Published: 2026-01-13T04:53:37.000Z
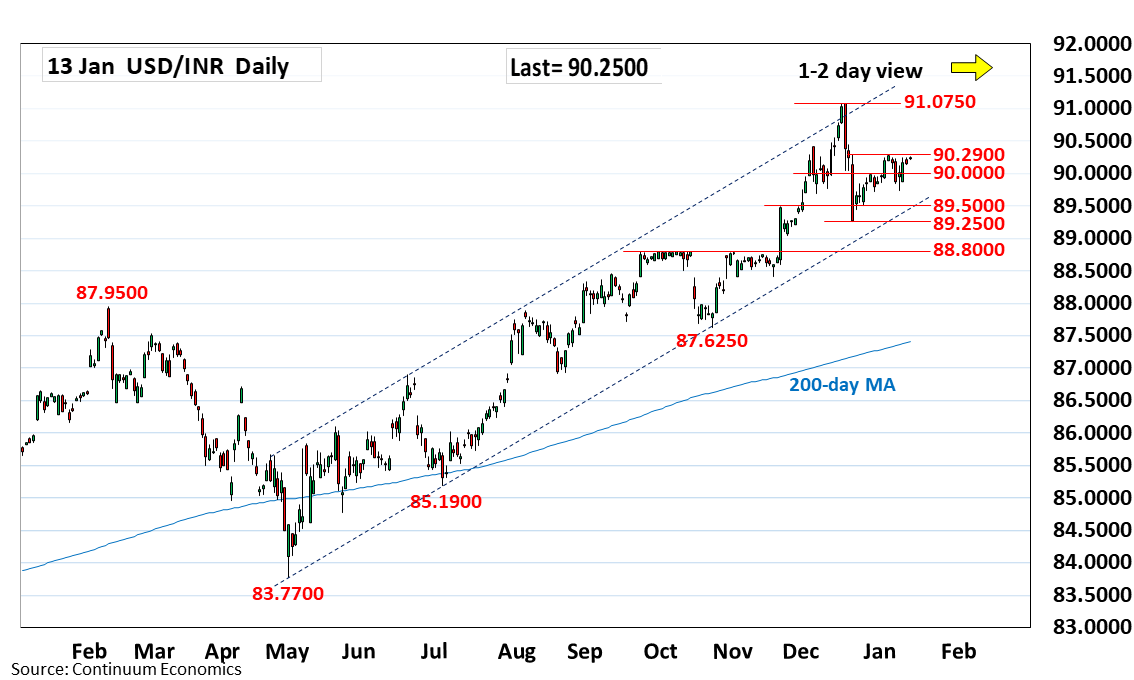
Chart USD/INR Update: Consolidating beneath 90.2900 resistance
-
Little change, as prices extend consolidation beneath resistance at the 90.2900 high
| Level | Comment | Level | Comment | |||||
|---|---|---|---|---|---|---|---|---|
| R4 | 91.0750 | ** | Dec 2025 all-time high | S1 | 90.0000 | * | figure | |
| R3 | 90.5000 | * | congestion | S2 | 89.7200 | ** | 30 Dec low | |
| R2 | 90.4200 | * | 4 Dec high | S3 | 89.5000 | * | congestion | |
| R1 | 90.2900 | ** | 5 Jan high | S4 | 89.2500 | ** | Dec low |
Asterisk denotes strength of level
04:50 GMT - Little change, as prices extend consolidation beneath resistance at the 90.2900 high. Break here will further extend gains from the 89.2500 December low to retrace losses from the 91.0750 all-time high to resistance at the 90.4200/90.5000 area which is expected to cap. Clearance here, if seen, will expose the 91.075 high to retest. Meanwhile, support is raised to the 90.0000 figure then the 89.7200 low. Break of the latter will return focus to the downside for retest of the 89.2500 low and see scope to further retrace the May/December rally.