Published: 2025-12-16T03:31:33.000Z
Chart USD/THB Update: Consolidating losses to 31.42, current year low
1
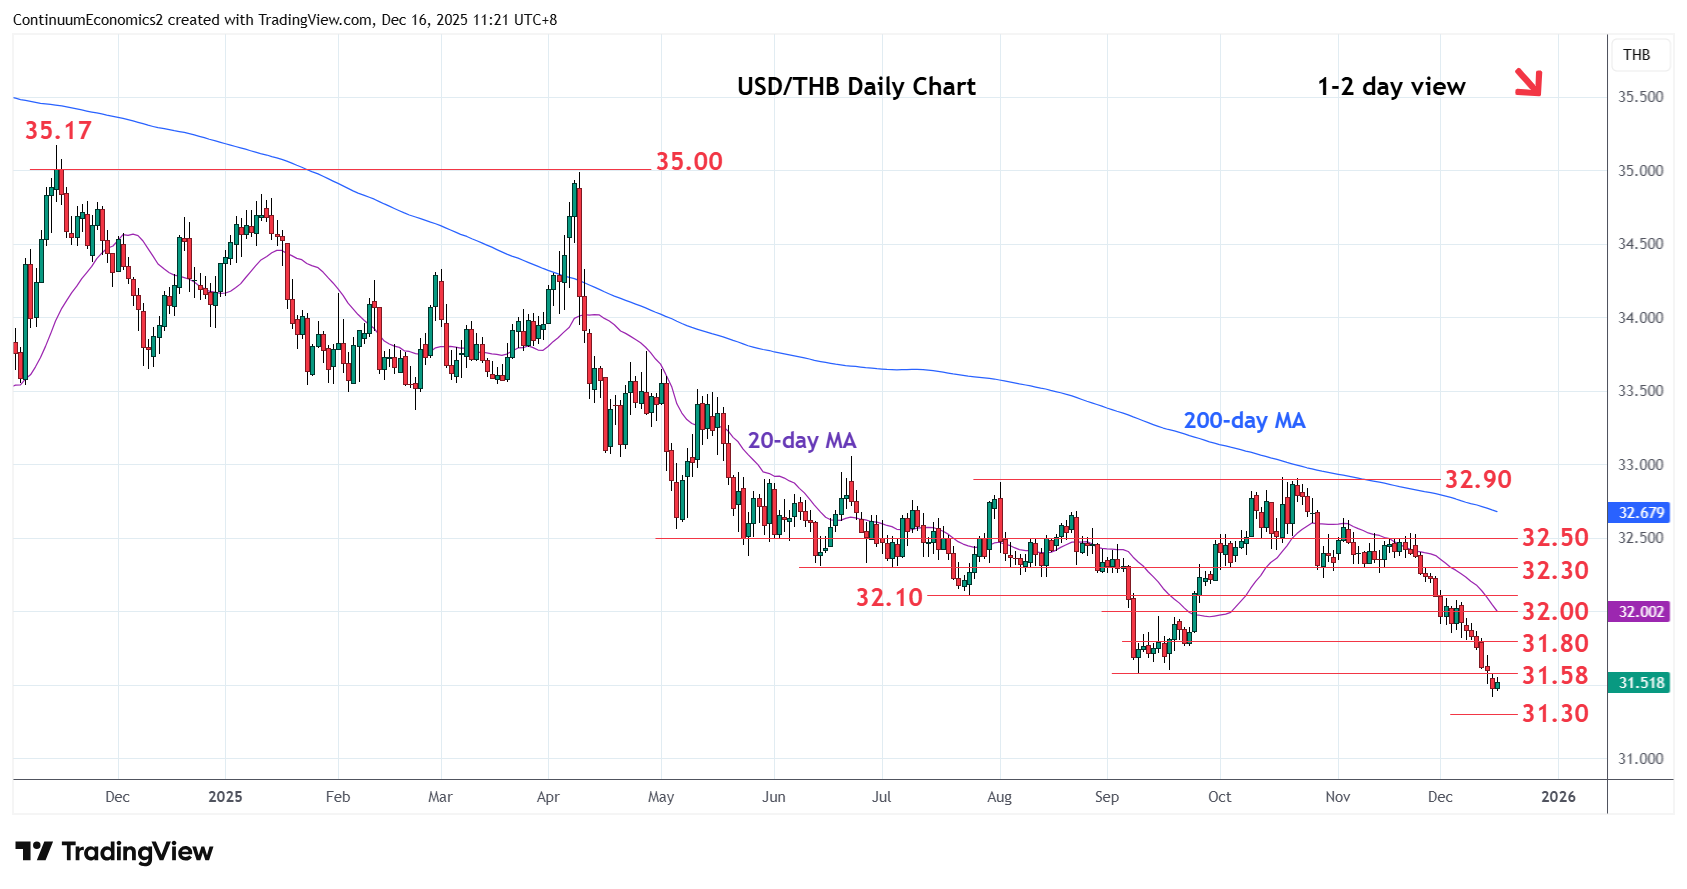
Turned up from the 31.42 current year low to consolidate recent steep losses as prices unwind oversold intraday and daily studies
| Level | Comment | Level | Comment | |||||
|---|---|---|---|---|---|---|---|---|
| R4 | 32.10 | ** | Jul low | S1 | 31.42 | * | 15 Dec YTD low | |
| R3 | 32.00 | * | congestion | S2 | 31.30 | * | congestion | |
| R2 | 31.80 | * | congestion | S3 | 31.00 | * | figure, congestion | |
| R1 | 31.58/60 | * | Sep low, congestion | S4 | 30.80 | * | congestion |
Asterisk denotes strength of level
03:25 GMT - Turned up from the 31.42 current year low to consolidate recent steep losses as prices unwind oversold intraday and daily studies. However, the downside remains vulnerable and lower will further extend the broader losses from the 2022 year high to support at the 31.30 congestion and the 31.00 level. Meanwhile, resistance is lowered to 31.58/60, September low. Would need lift over this ease the downside pressure and see room for stronger corrective bounce to resistance at the 31.80/32.00 congestion area.