Published: 2026-03-06T05:20:52.000Z
Chart USD/INR Update: Consolidating above 91.5000 support
3
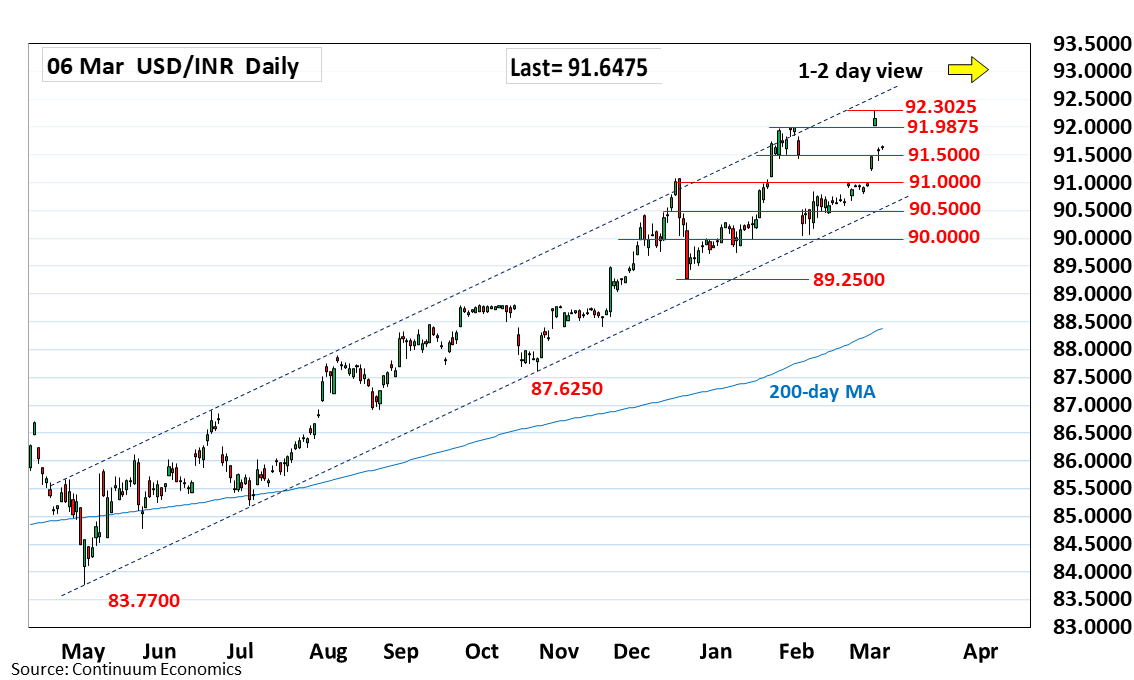
Extending consolidation above support at 91.5000 congestion following bounce from the 91.4025 low
| Level | Comment | Level | Comment | |||||
|---|---|---|---|---|---|---|---|---|
| R4 | 92.7800 | * | extension | S1 | 91.5000 | * | congestion | |
| R3 | 92.5000 | * | extension | S2 | 91.4025 | ** | 5 Mar low | |
| R2 | 92.3025 | ** | 4 Mar all-time high | S3 | 91.0750 | ** | Dec 2025 year high | |
| R1 | 91.9875 | * | Jan high | S4 | 90.5000 | * | congestion |
Asterisk denotes strength of level
05:15 GMT - Extending consolidation above support at 91.5000 congestion following bounce from the 91.4025 low. However, overbought daily studies suggest room for deeper pullback from the 92.3025 historic high to retrace gains from the 90.0450, February low. Below the 91.5000/91.4025 support will open up room for deeper pullback to strong support at 91.0750/91.0000, December 2025 year high and congestion area. Meanwhile, resistance is at the 91.9875 January high which is expected to cap and sustain losses from the 92.3025 high.