Published: 2025-09-30T04:47:20.000Z
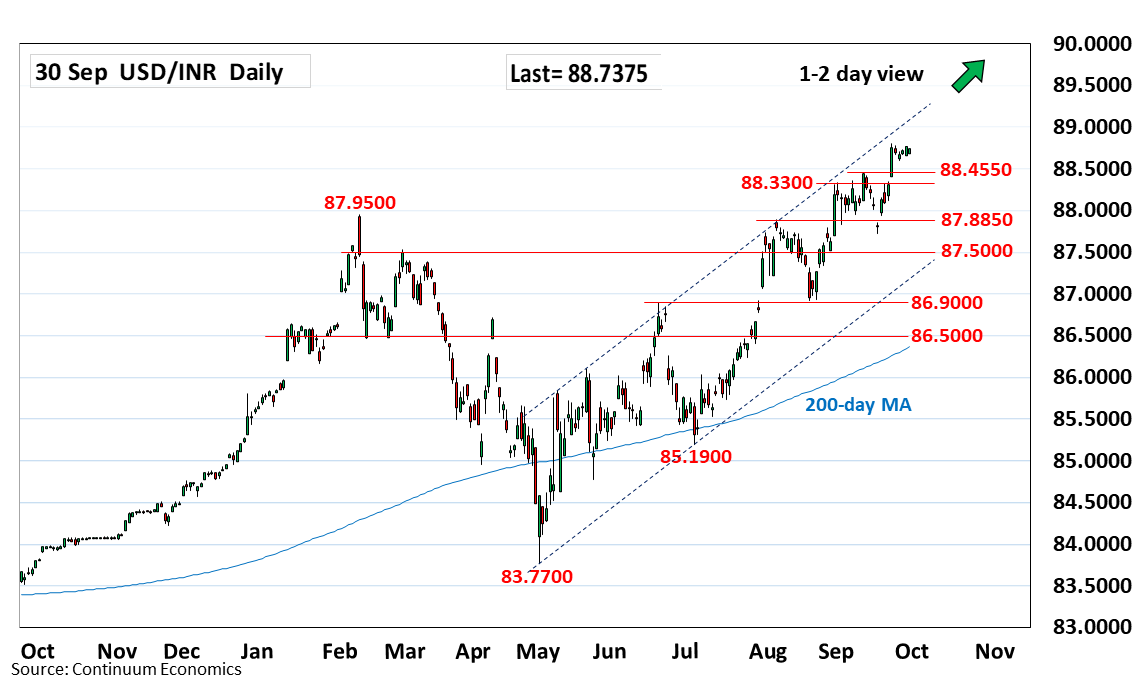
Chart USD/INR Update: Poised just below 88.7975 all-time high
-
Little change, as prices extend consolidation within a narrow range below the 88.7975 all-time high
| Level | Comment | Level | Comment | |||||
|---|---|---|---|---|---|---|---|---|
| R4 | 91.5000 | * | projection | S1 | 88.4450 | ** | 11 Sep high | |
| R3 | 90.0000 | ** | psychological | S2 | 88.3300 | * | 1 Sep high | |
| R2 | 89.0000 | * | figure | S3 | 88.0000 | * | congestion | |
| R1 | 88.7975 | ** | 23 Sep all-time high | S4 | 87.8850 | ** | 5 Aug high |
Asterisk denotes strength of level
04:45 GMT - Little change, as prices extend consolidation within a narrow range below the 88.7975 all-time high. The resulting flag pattern suggest scope for break to further extend gains within the bull channel from the May low. Higher will see room for extension to target 89.0000 figure and the 90.0000 psychological level. However, overbought daily studies caution corrective pullback with the September highs at the 88.4450/88.3300 area now turned support. Would take break here to fade the upside pressure and trigger corrective pullback.