Published: 2026-01-19T03:03:20.000Z
Chart USD/THB Update: Extend consolidation
-
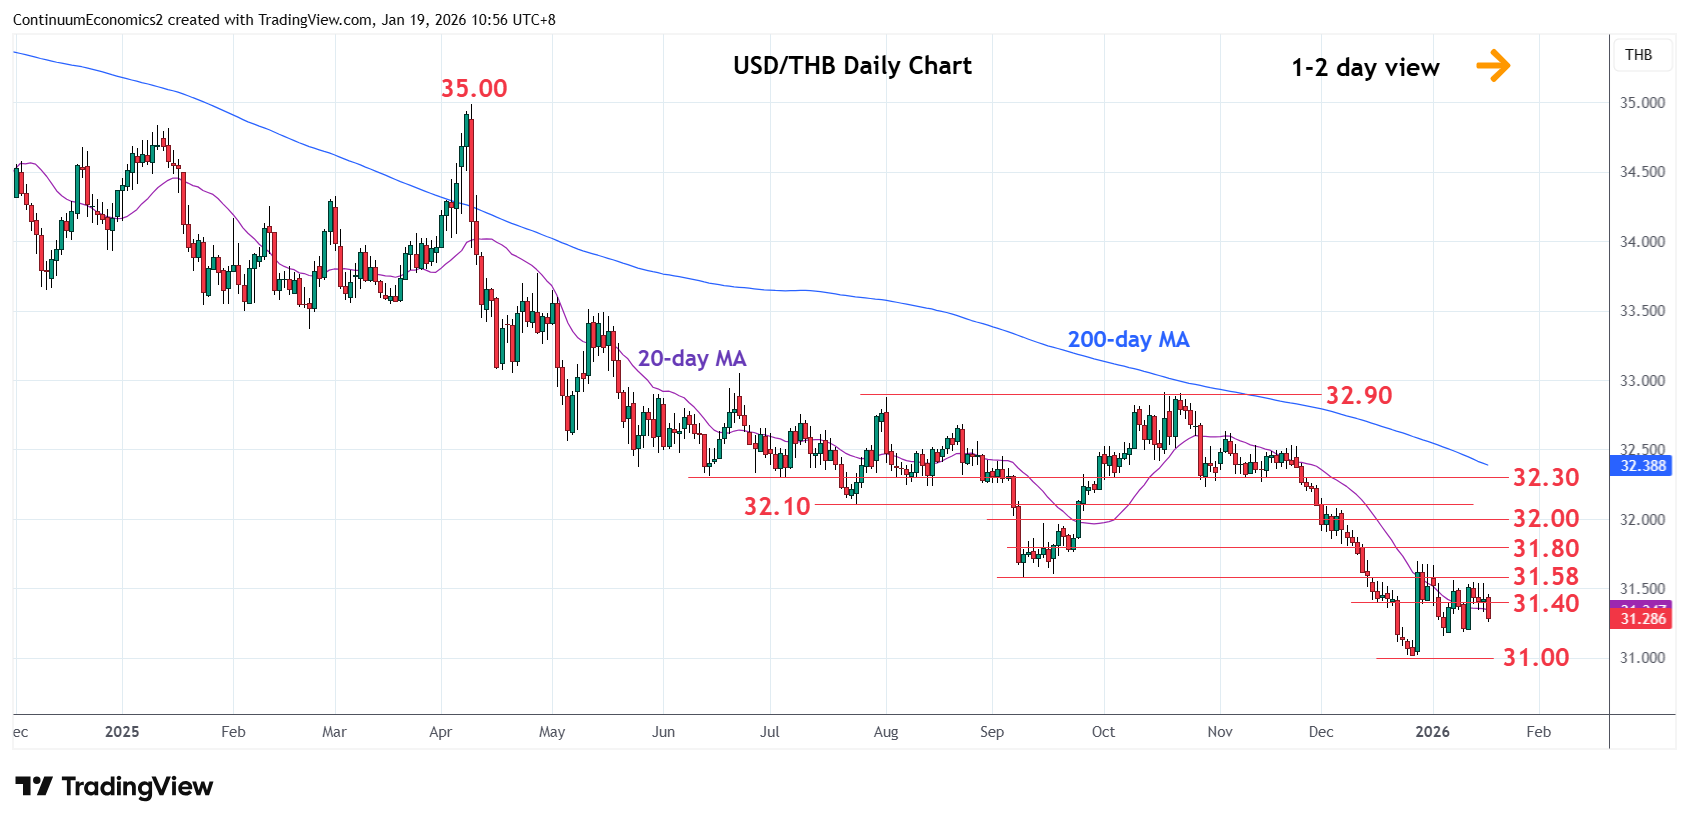
Little change, as prices extend choppy trade within the 31.58/31.16 area
| Level | Comment | Level | Comment | |||||
|---|---|---|---|---|---|---|---|---|
| R4 | 32.00 | * | figure, congestion | S1 | 31.16 | * | 6 Jan low | |
| R3 | 31.80 | * | congestion | S2 | 31.00 | ** | 26 Dec 2025 year low | |
| R2 | 31.70 | ** | 29 Dec high | S3 | 30.80 | * | Jun 2020 low | |
| R1 | 31.58 | * | Sep low | S4 | 30.60 | * | congestion |
Asterisk denotes strength of level
02:55 GMT - Little change, as prices extend choppy trade within the 31.58/31.16 area. Consolidation from the 31.00 late-December low within a narrowing range see prices tracing out a triangle pattern and threatening pullback to support at 31.16 and 31.00 leve. Break of these will extend the broader losses from the September 2022 year high and see room for extension to support at the 30.80/30.60 congestion area. Meanwhile, resistance at the 31.58 and 31.70 highs are expected to cap. Clearance needed to open up room for stronger gains to retrace the October/December losses.