Published: 2025-10-24T05:16:48.000Z
Chart USD/INR Update: Extending losses
1
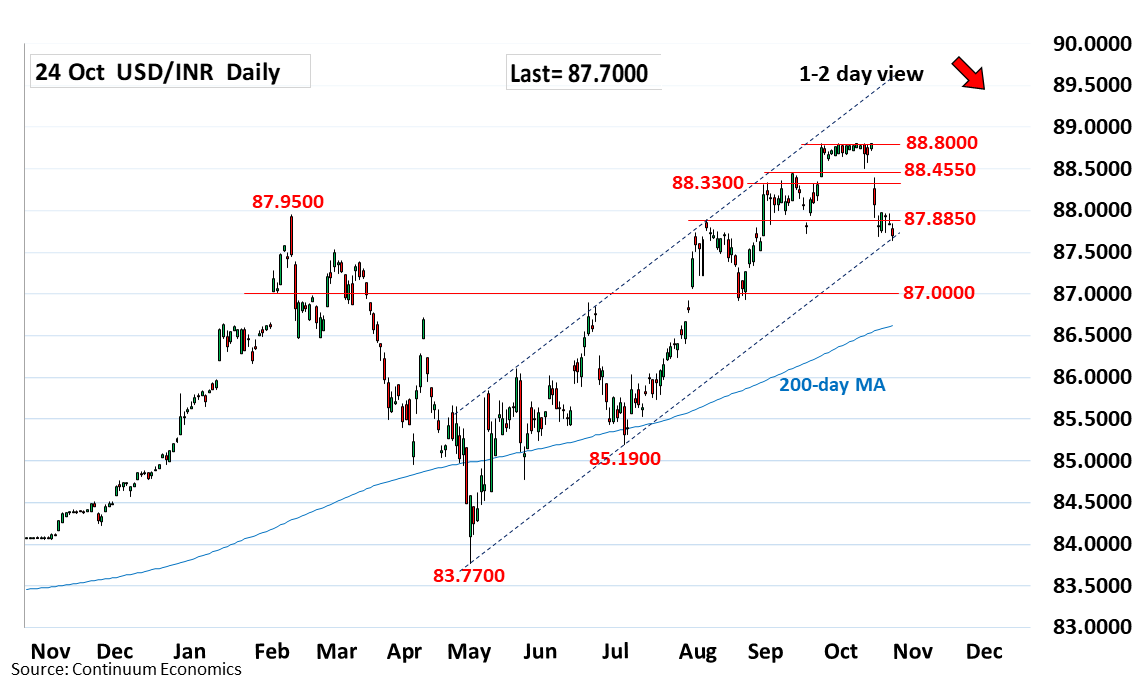
Under pressure as consolidation below 88.0000 level see prices giving way to fresh selling pressure
| Level | Comment | Level | Comment | |||||
|---|---|---|---|---|---|---|---|---|
| R4 | 88.5000 | ** | 10 Oct low | S1 | 87.6900 | 16 Oct low | ||
| R3 | 88.4550 | * | Sep high | S2 | 87.5000 | * | congestion | |
| R2 | 88.3300 | * | 1 Sep high | S3 | 87.4200 | * | 38.2% Jul/Sep rally | |
| R1 | 88.0000 | * | figure | S4 | 87.0000 | * | congestion, 50% |
Asterisk denotes strength of level
05:10 GMT - Under pressure as consolidation below 88.0000 level see prices giving way to fresh selling pressure. Daily and weekly studies are tracking lower and break of the 87.6900 low of last week will see room to extend pullback from the 88.8000 all-time high to the 87.5000 congestion and 87.4200, 38.2% Fibonacci level. Lower still, will turn focus to 87.0000 figure and 50% Fibonacci level. Meanwhile, resistance at the 88.0000 level is expected to cap corrective bounce and sustain losses from the 88.8000 high.