Published: 2026-02-19T04:51:51.000Z
Chart USD/IDR Updates: Extending gains
4
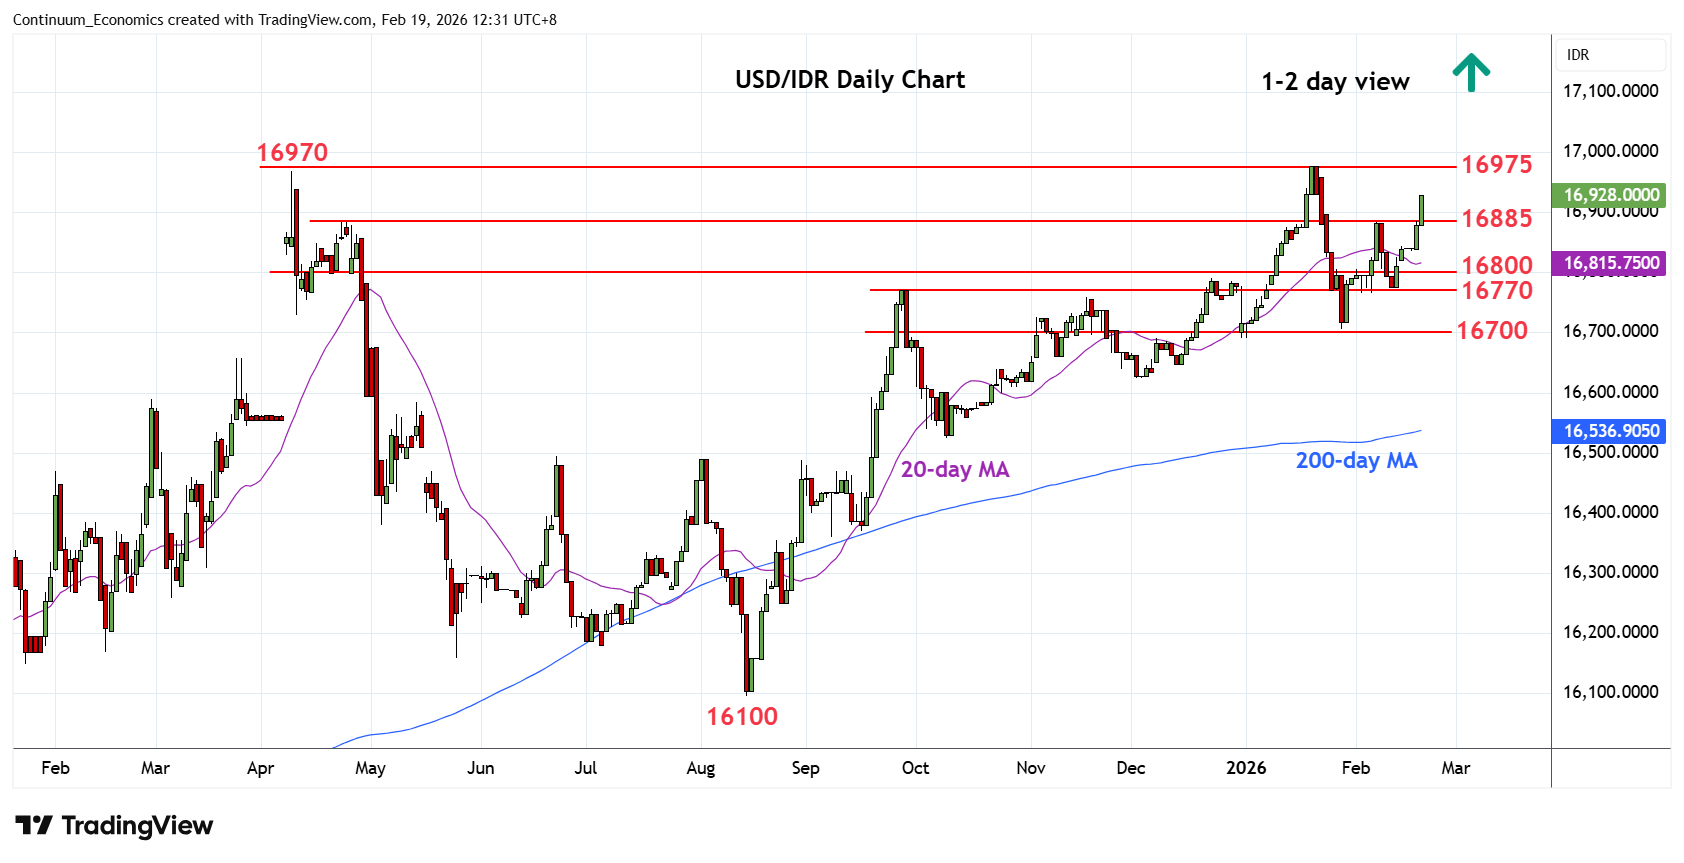
Break above the 16885 congestion has seen prices reaching resistance the 16930 congestion
| Levels | Imp | Comment | Levels | Imp | Comment | |||
|---|---|---|---|---|---|---|---|---|
| R4 | 17100 | figure | S1 | 16850 | congestion | |||
| R3 | 17050 | * | extension | S2 | 16800 | * | congestion | |
| R2 | 16975 | ** | 20 Jan all-time high | S3 | 16770 | * | Sep high | |
| R1 | 16930 | * | congestion | S4 | 16705 | ** | 28 Jan YTD low |
Asterisk denotes strength of level
04:45 GMT - Break above the 16885 congestion has seen prices reaching resistance the 16930 congestion. Above here will see potential for retest of the 16970/16975, April 2025 year high and 20 January all-time high. Would expect reaction at the latter but clearance here cannot be ruled out to further extend the underlying bull trend. Meanwhile, support at the 16850/16800 congestion should underpin. Would take break here and the 16770 support to return focus to the 16705 low and see room for deeper pullback to retrace the August/January gains.