Published: 2026-02-27T06:28:22.000Z
Chart USD/PHP Updates: Higher in range in consolidation
2
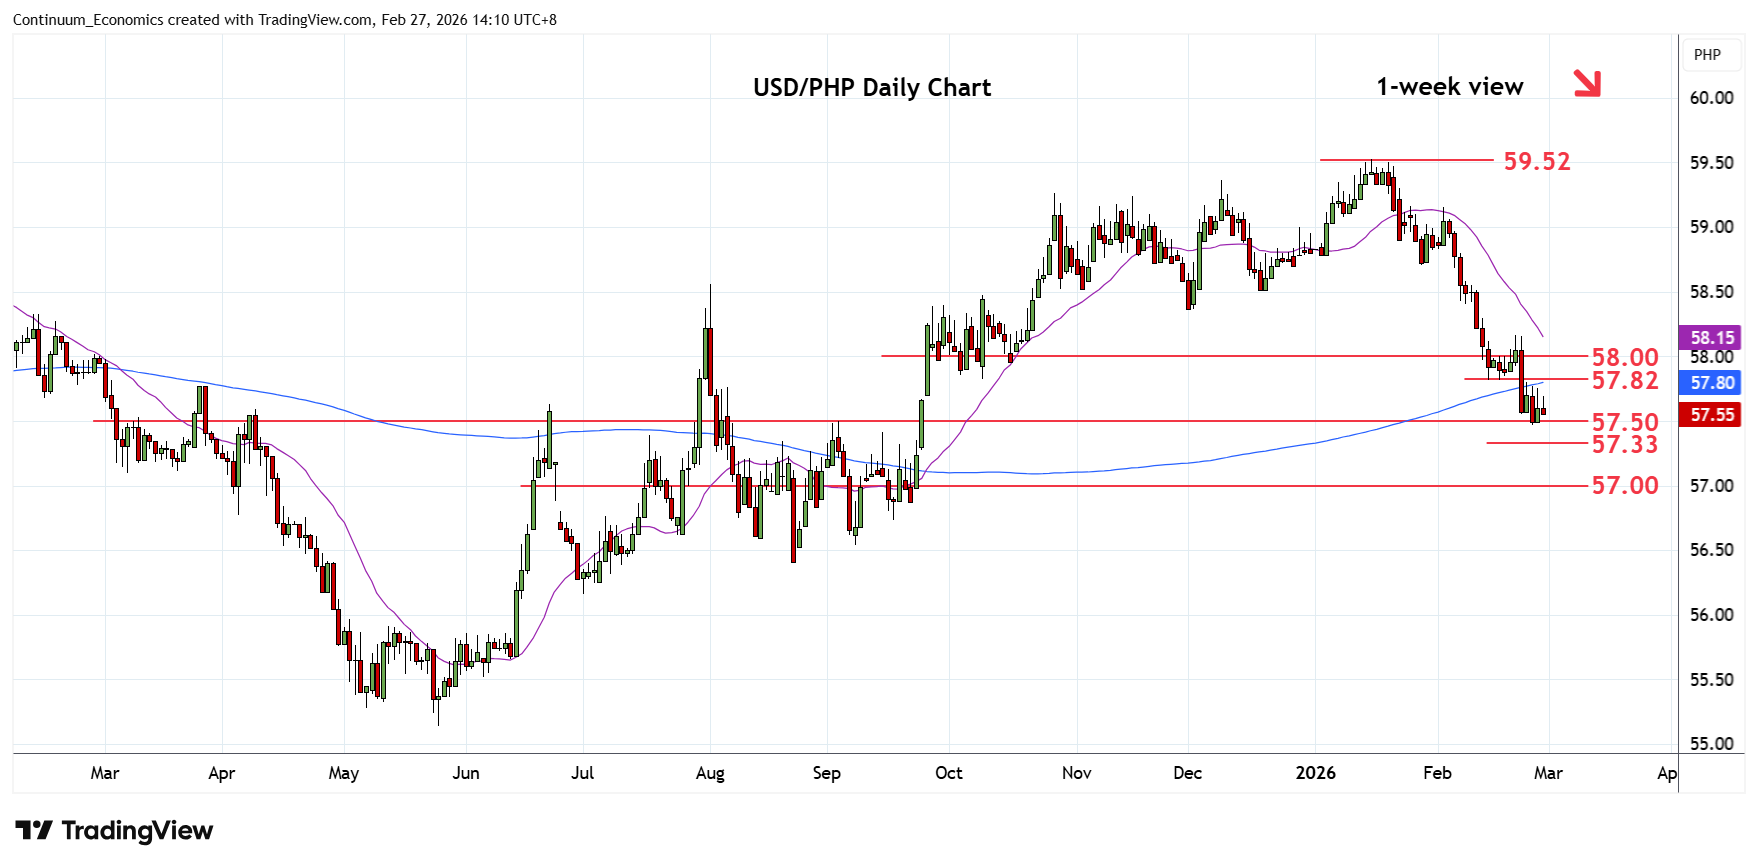
Turned up in range from the 57.470 low as prices consolidate losses from the 58.160 high
| Level | Comment | Level | Comment | |||||
|---|---|---|---|---|---|---|---|---|
| R4 | 58.360 | * | Dec low | S1 | 57.470 | * | 25 Feb low | |
| R3 | 58.160 | ** | 20 Feb high | S2 | 57.330 | * | 50% May/Jan rally | |
| R2 | 58.000 | * | congestion | S3 | 57.000 | ** | congestion | |
| R1 | 57.820 | * | 13 Feb low | S4 | 56.800 | * | 61.8% May/Jan rally |
Asterisk denotes strength of level
06:20 GMT - Turned up in range from the 57.470 low as prices consolidate losses from the 58.160 high to unwind oversold intraday studies. However, negative daily studies keep pressure on the downside and see scope for break to further retrace the May/January rally. Lower will see room to 57.330, 50% Fibonacci level and strong support at the 57.000 congestion where reaction can be expected. Meanwhile, resistance is at the 57.820/58.000 area which should cap and keep bounce attempt in check. Regaining this will ease the downside pressure and see room for stronger gains to 58.360/58.500 area.