Published: 2026-01-22T06:03:24.000Z
Chart USD/IDR Updates: Settling back from 16975 record high
1
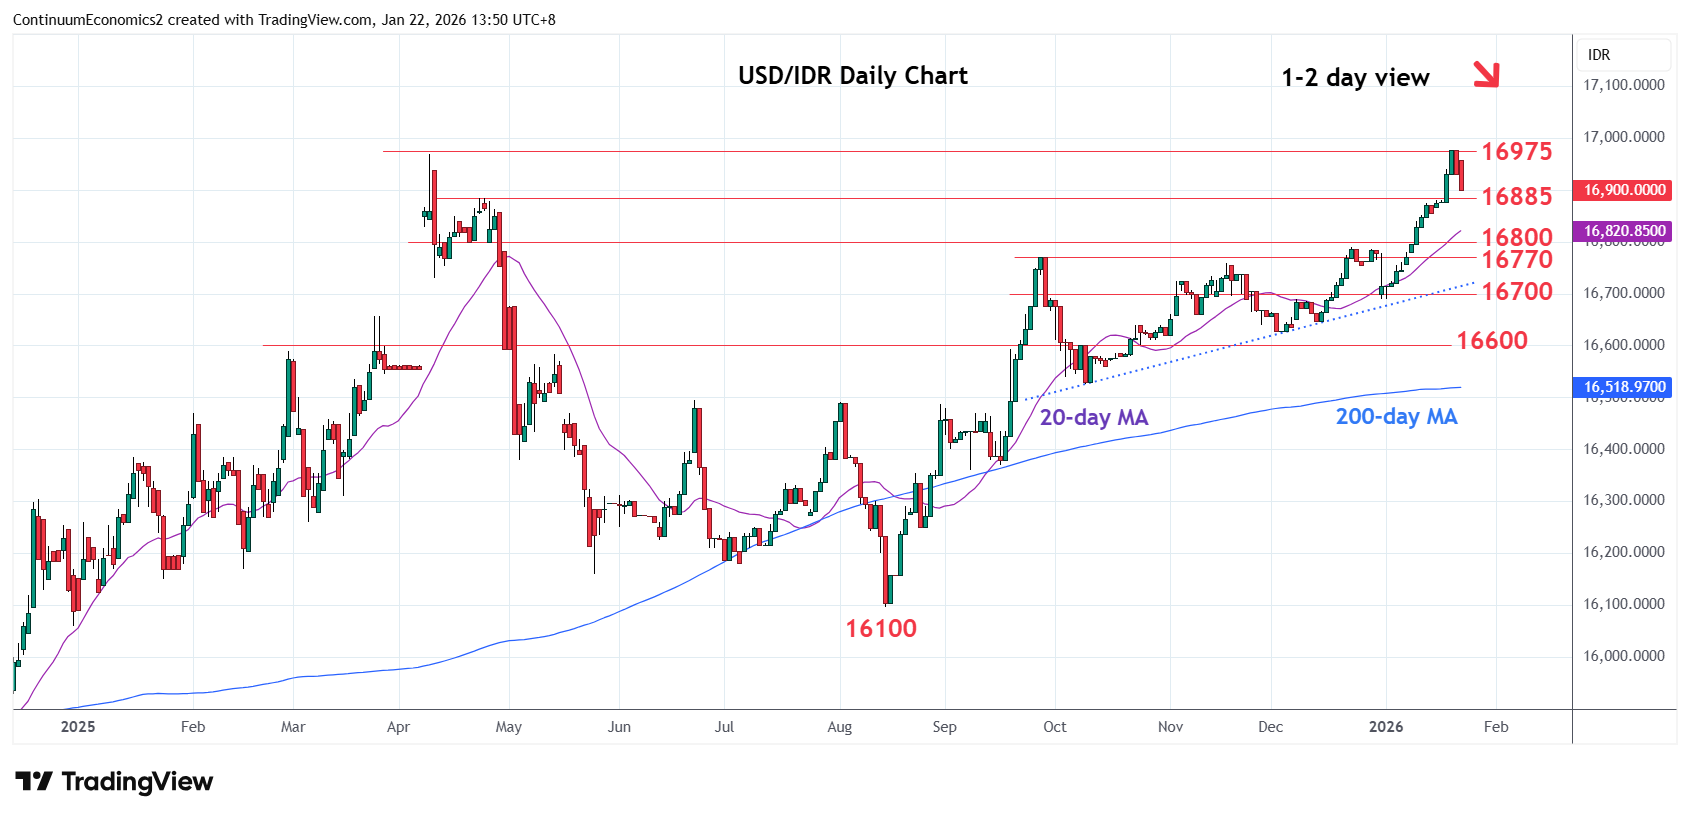
Settling back from fresh marginal high at 16975 as prices unwind overbought intraday and daily studies
| Levels | Imp | Comment | Levels | Imp | Comment | |||
|---|---|---|---|---|---|---|---|---|
| R4 | 17500 | * | projection | S1 | 16900/885 | * | congestion, 23 Apr high | |
| R3 | 17270 | * | projection | S2 | 16800 | * | congestion | |
| R2 | 17050 | * | projection | S3 | 16770 | * | Sep high | |
| R1 | 16975 | ** | 20 Jan all-time high | S4 | 16690 | ** | 31 Dec low |
Asterisk denotes strength of level
06:00 GMT - Settling back from fresh marginal high at 16975 as prices unwind overbought intraday and daily studies. Pullback see support starting at the 16900/16885 congestion and previous high. Would take break here to ease the upside pressure and open up room for deeper pullback to strong support at the 16800/16770 congestion area and September high which is expected to underpin. Meanwhile, resistance at 16970/16975 highs now expected to cap. Clearance will extend the underlying bull trend and see room to 17050 projection target.