Published: 2026-04-24T02:56:33.000Z
Chart USD/MYR Update: Higher in consolidation from 3.9400 low
1
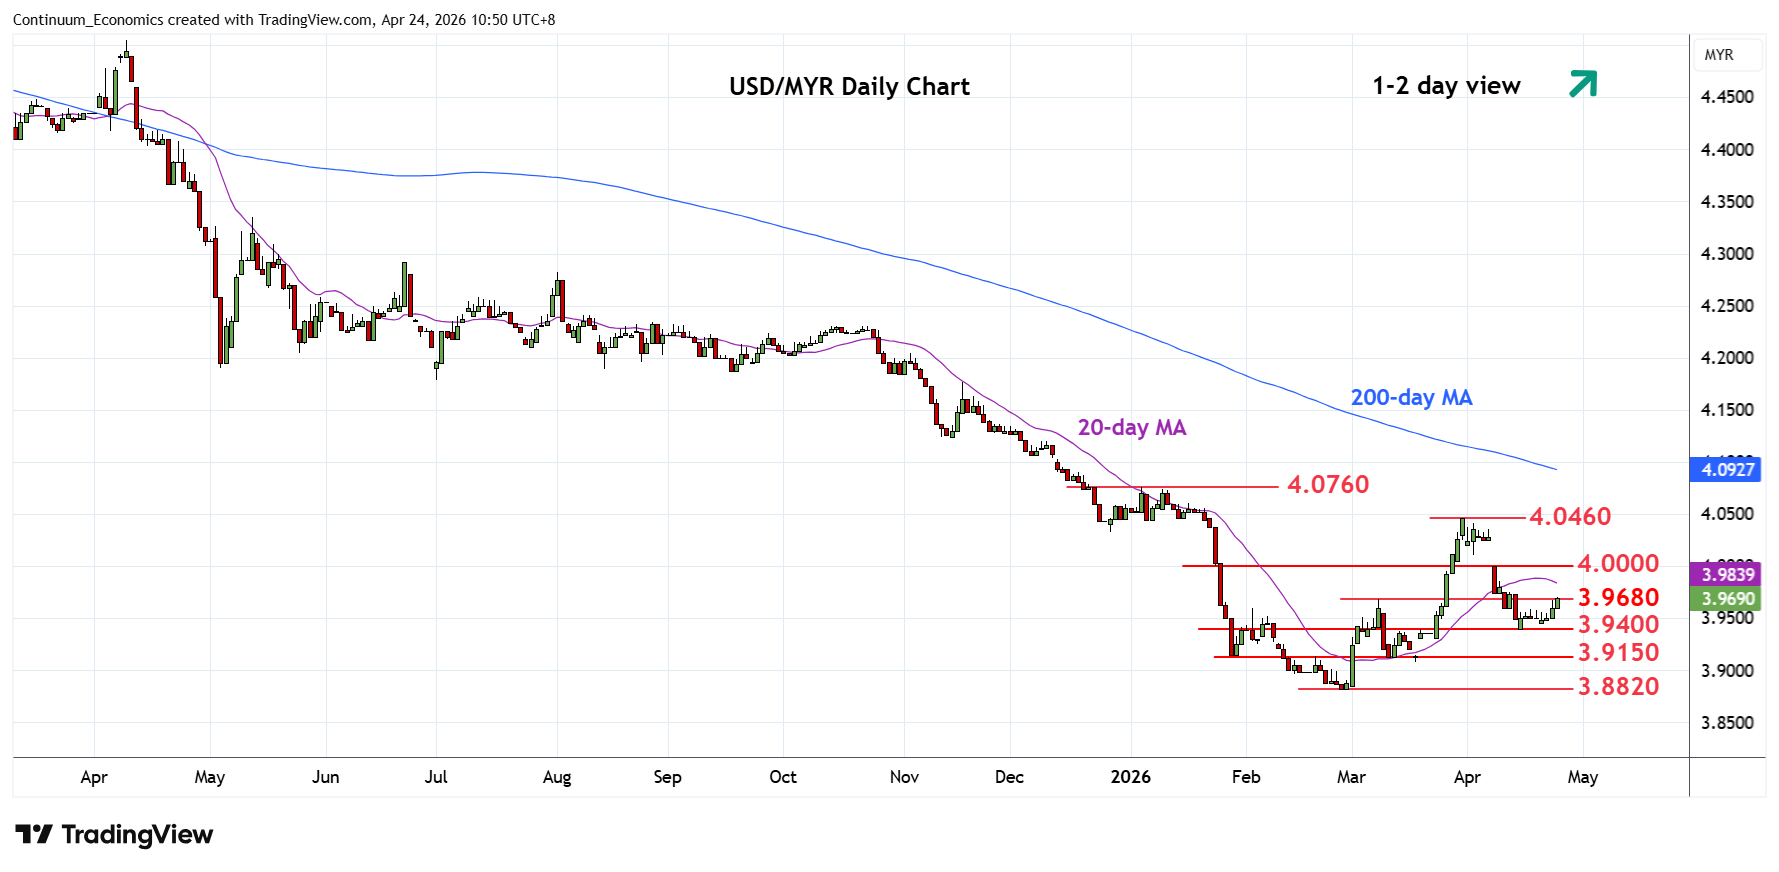
Edging up from the 3.9400 low as prices consolidate losses from the 4.0460 March high
| Levels | Imp | Comment | Levels | Imp | Comment | |||
|---|---|---|---|---|---|---|---|---|
| R4 | 4.0460 | ** | 31 Mar high | S1 | 3.9400 | * | 15 Apr low | |
| R3 | 4.0100 | * | 2 Apr low | S2 | 3.9300 | * | congestion | |
| R2 | 4.0000 | * | congestion | S3 | 3.9150 | * | Jan low, congestion | |
| R1 | 3.9680 | * | 9 Mar high | S4 | 3.8820 | ** | 26 Feb YTD low |
Asterisk denotes strength of level
02:50 GMT - Edging up from the 3.9400 low as prices consolidate losses from the 4.0460 March high as daily studies unwind oversold reading. Break above resistance at the 3.9680 high of 9 March will see room for stronger bounce to the 4.0000 figure which is expected to cap. Corrective bounce is expected to give way to renewed selling pressure later, break of the 3.9400 low will see room to lower support at the 3.9300 congestion and 3.9150, January low. Below the latter will return focus to the 3.8820 February current year low.