Published: 2025-12-17T02:31:20.000Z
Chart USD/SGD Update: Turned up consolidation
-
Turned up from above the 1.2865/50 support and 61.8% Fibonacci level as prices unwind oversold intraday studies
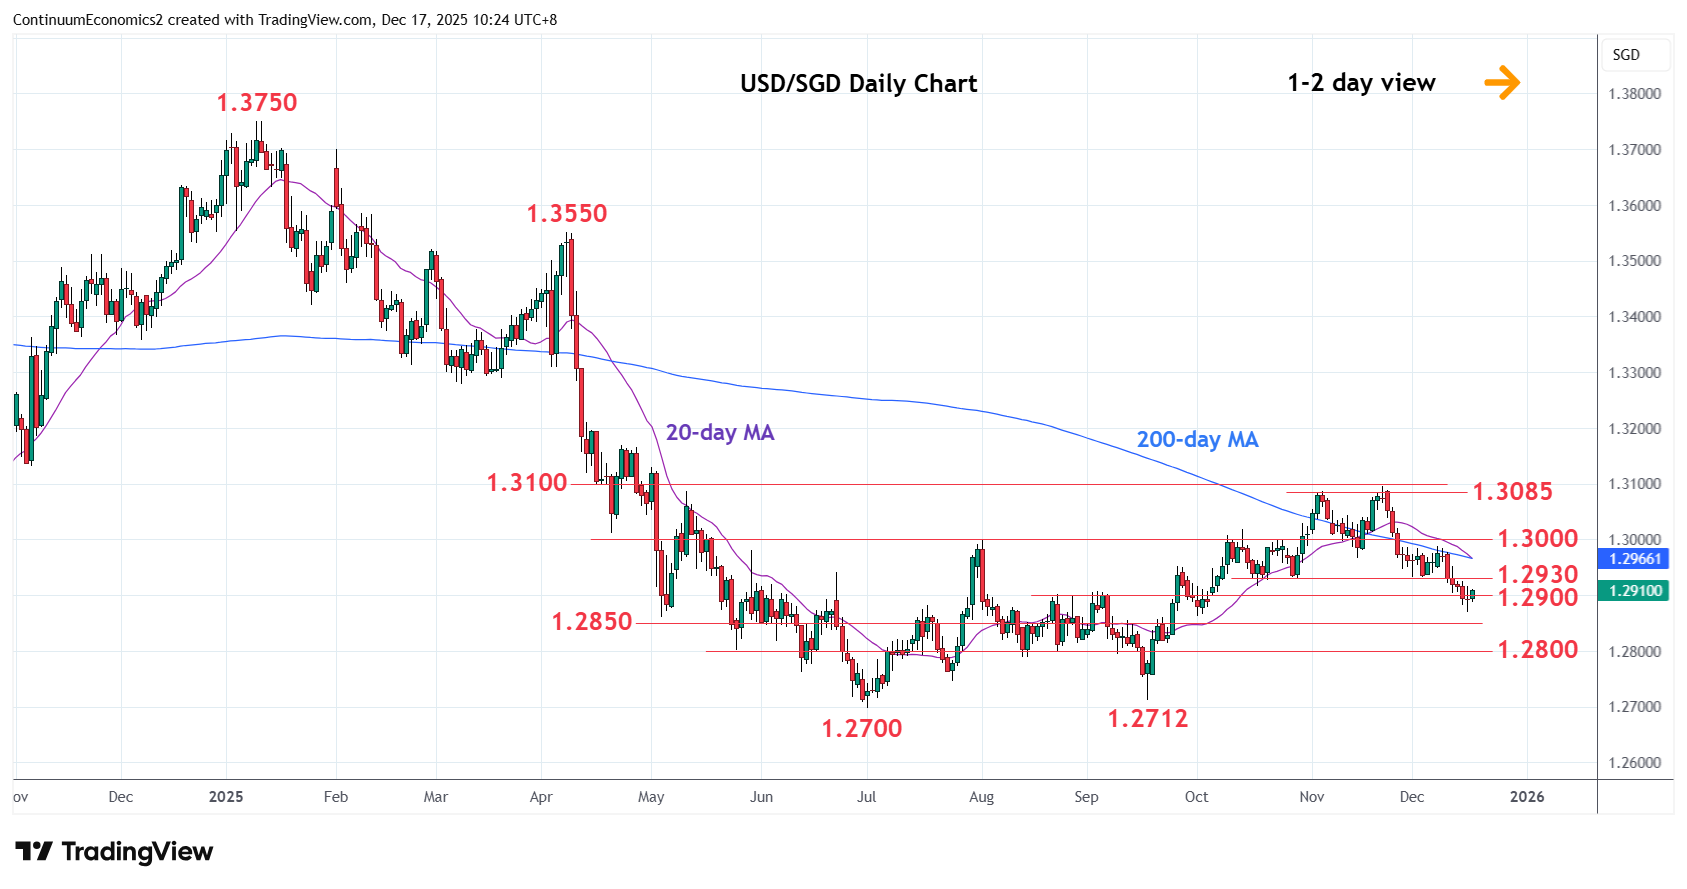
| Level | Comment | Level | Comment | ||||
|---|---|---|---|---|---|---|---|
| R4 | 1.3100 | ** | congestion, 38.2% | S1 | 1.2865/50 | * | 1 Oct low, 61.8% |
| R3 | 1.3085 | * | 12 May high | S2 | 1.2800 | ** | May low, congestion |
| R2 | 1.3000 | ** | Aug high, congestion | S3 | 1.2750 | * | congestion |
| R1 | 1.2900/30 | * | congestion | S4 | 1.2712/00 | ** | Sep, Jul YTD lows |
Asterisk denotes strength of level
02:30 GMT - Turned up from above the 1.2865/50 support and 61.8% Fibonacci level as prices unwind oversold intraday studies. Daily studies are stretched as well and suggest scope for corrective bounce to the 1.2930 resistance. Break here, if seen, will open up room for stronger recovery to retrace losses from the 1.3100 November high to the 1.2900/30 resistance. However, corrective bounce is expected to give way to fresh selling pressure later. Break of the 1.2865/50 support will see extension to the 1.2800, May low and congestion area.