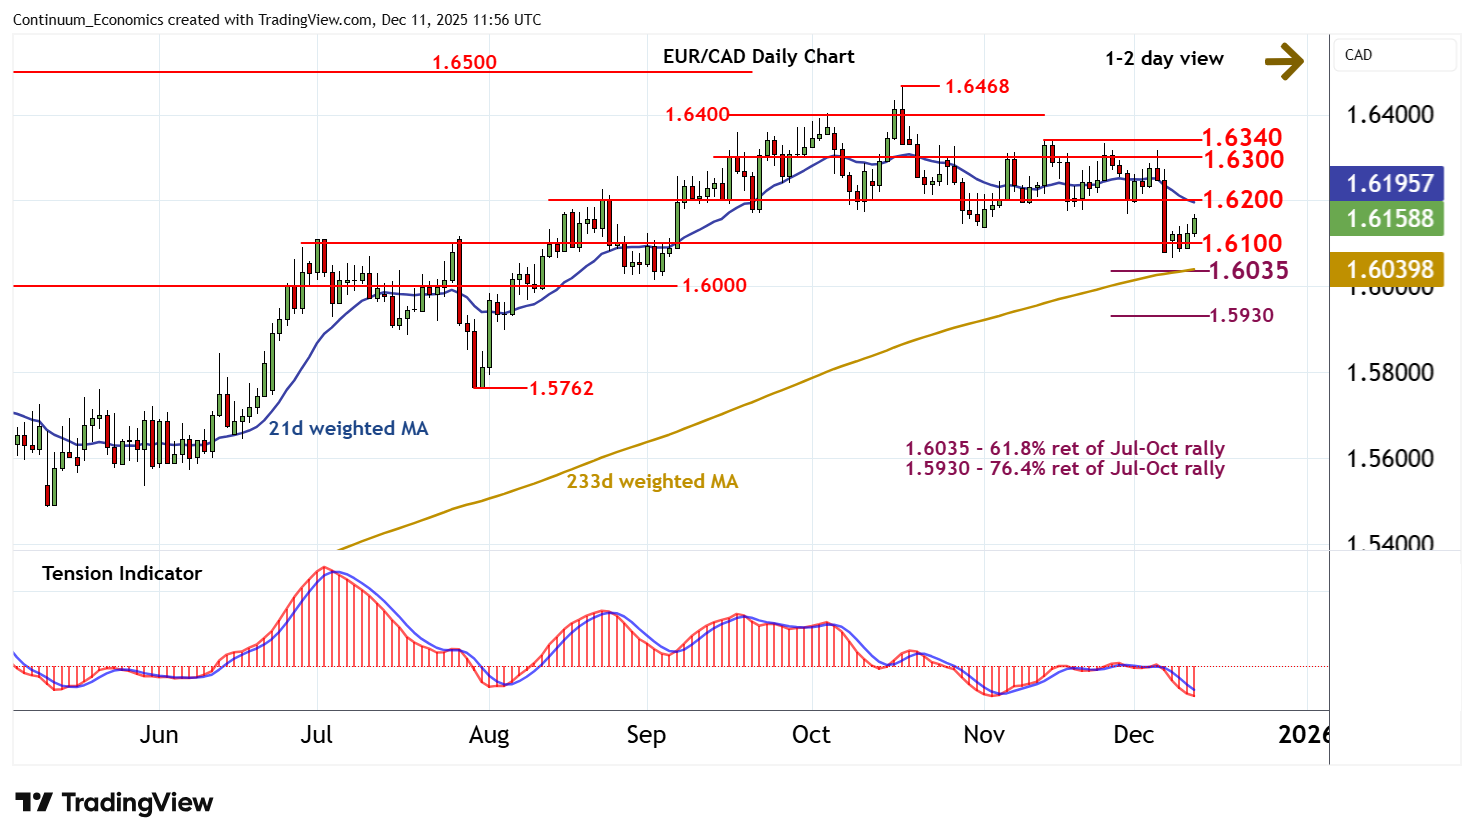
Chart EUR/CAD Update: Limited tests higher - background studies under pressure
Consolidation around congestion support at 1.6100 has given way to a bounce
| Level | Comment | Level | Comment | |||||
|---|---|---|---|---|---|---|---|---|
| R4 | 1.6400 | * | break level | S1 | 1.6100 | * | congestion | |
| R3 | 1.6340 | * | 13 Nov (m) high | S2 | 1.6065 | 8 Dec low | ||
| R2 | 1.6300 | * | congestion | S3 | 1.6035 | ** | 61.8% ret of Jul-Oct rally | |
| R1 | 1.6200 | * | congestion | S4 | 1.6000 | * | congestion |
Asterisk denotes strength
11:45 GMT - Consolidation around congestion support at 1.6100 has given way to a bounce, with prices currently trading around 1.6160. Intraday studies are mixed/positive and oversold daily stochastics are unwinding, highlighting room for further strength. But the negative daily Tension Indicator and mixed/negative weekly charts are expected to limit scope in renewed selling interest/consolidation towards congestion resistance at 1.6200. Following corrective trade, fresh losses are looked for. A later break below 1.6100 will add weight to sentiment and extend mid-October losses towards the 1.6035 Fibonacci retracement. However, already oversold weekly stochastics could limit any initial tests in consolidation, before October losses extend still further.