Published: 2026-04-15T02:45:29.000Z
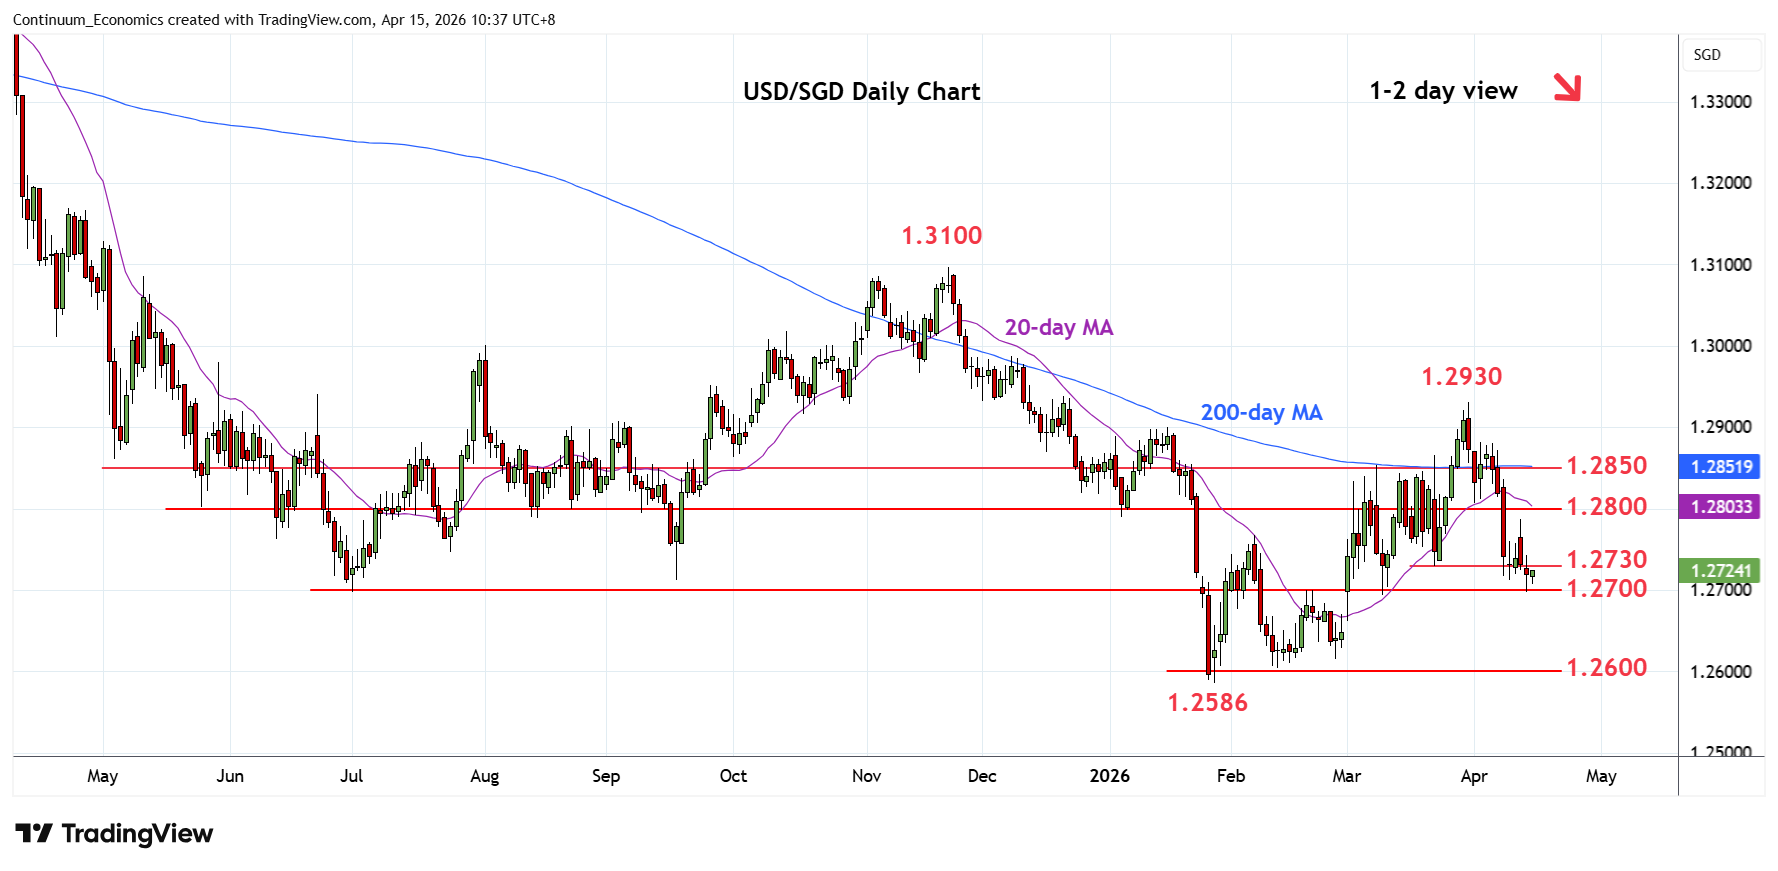
Chart USD/SGD Update: Consolidating at 1.2700 support
1
Choppy trade through the 1.2730 support has seen extension to tag strong support at the 1.2700 level
| Level | Comment | Level | Comment | ||||
|---|---|---|---|---|---|---|---|
| R4 | 1.2900 | * | Jan high | S1 | 1.2700 | ** | 19 Feb high, 2025 yr low |
| R3 | 1.2850 | * | congestion | S2 | 1.2650 | congestion | |
| R2 | 1.2785/00 | ** | 13 Apr high, congestion | S3 | 1.2600 | * | congestion |
| R1 | 1.2750 | congestion | S4 | 1.2586 | ** | 28 Jan YTD low |
Asterisk denotes strength of level
02:40 GMT - Choppy trade through the 1.2730 support has seen extension to tag strong support at the 1.2700 level. Consolidation here see prices unwinding oversold intraday and daily studies but this is expected to give way to renewed selling pressure later. Break here will extend losses from the 1.2930 March current year high and see room to the 1.2650/1.2600 congestion area and 1.2586, January YTD low. Meanwhile, resistance starts at 1.2750 congestion then the 1.2785/1.2800 area which is expected to cap and sustain losses from 1.2930 March swing high.