Published: 2025-11-05T03:10:12.000Z
Chart USD/THB Update: Extending corrective bounce
1
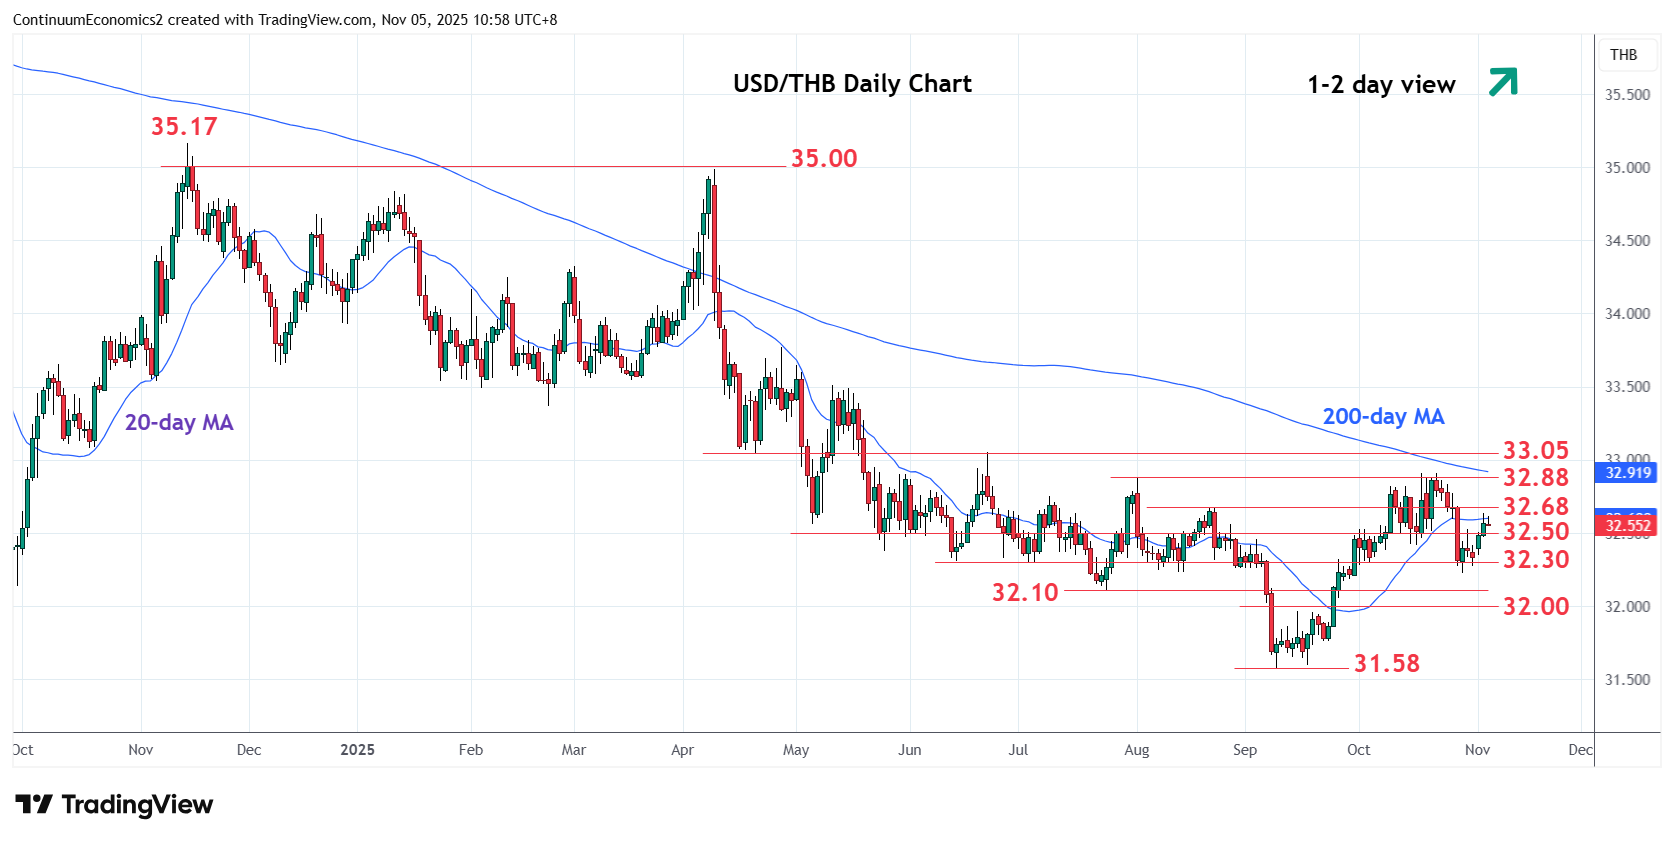
Extending bounce from the 32.23 low as prices unwind oversold daily studies and retrace losses from the 32.88/32.91 highs
| Level | Comment | Level | Comment | |||||
|---|---|---|---|---|---|---|---|---|
| R4 | 33.00/05 | ** | congestion, Jun high | S1 | 32.50 | * | congestion | |
| R3 | 32.95 | * | 38.2% Nov 2024/Sep fall | S2 | 32.30 | ** | Jun low, congestion | |
| R2 | 32.88 | ** | 1 Aug high, congestion | S3 | 32.23 | * | Oct low | |
| R1 | 32.68 | * | 22 Aug high | S4 | 32.10 | ** | Jul low |
Asterisk denotes strength of level
03:10 GMT - Extending bounce from the 32.23 low as prices unwind oversold daily studies and retrace losses from the 32.88/32.91 highs. Break above 32.50 congestion see room for stronger gains to the 32.68 resistance. Clearance, if seen, will expose the 32.88 and 32.91 highs to retest. However, negative weekly studies suggest this giving way to renewed selling pressure later. Below the 32.50 support will return focus to the downside for retest of support at the 32.30 congestion and the 32.23, October low.