Published: 2025-12-23T02:37:34.000Z
Chart USD/SGD Update: Under pressure
2
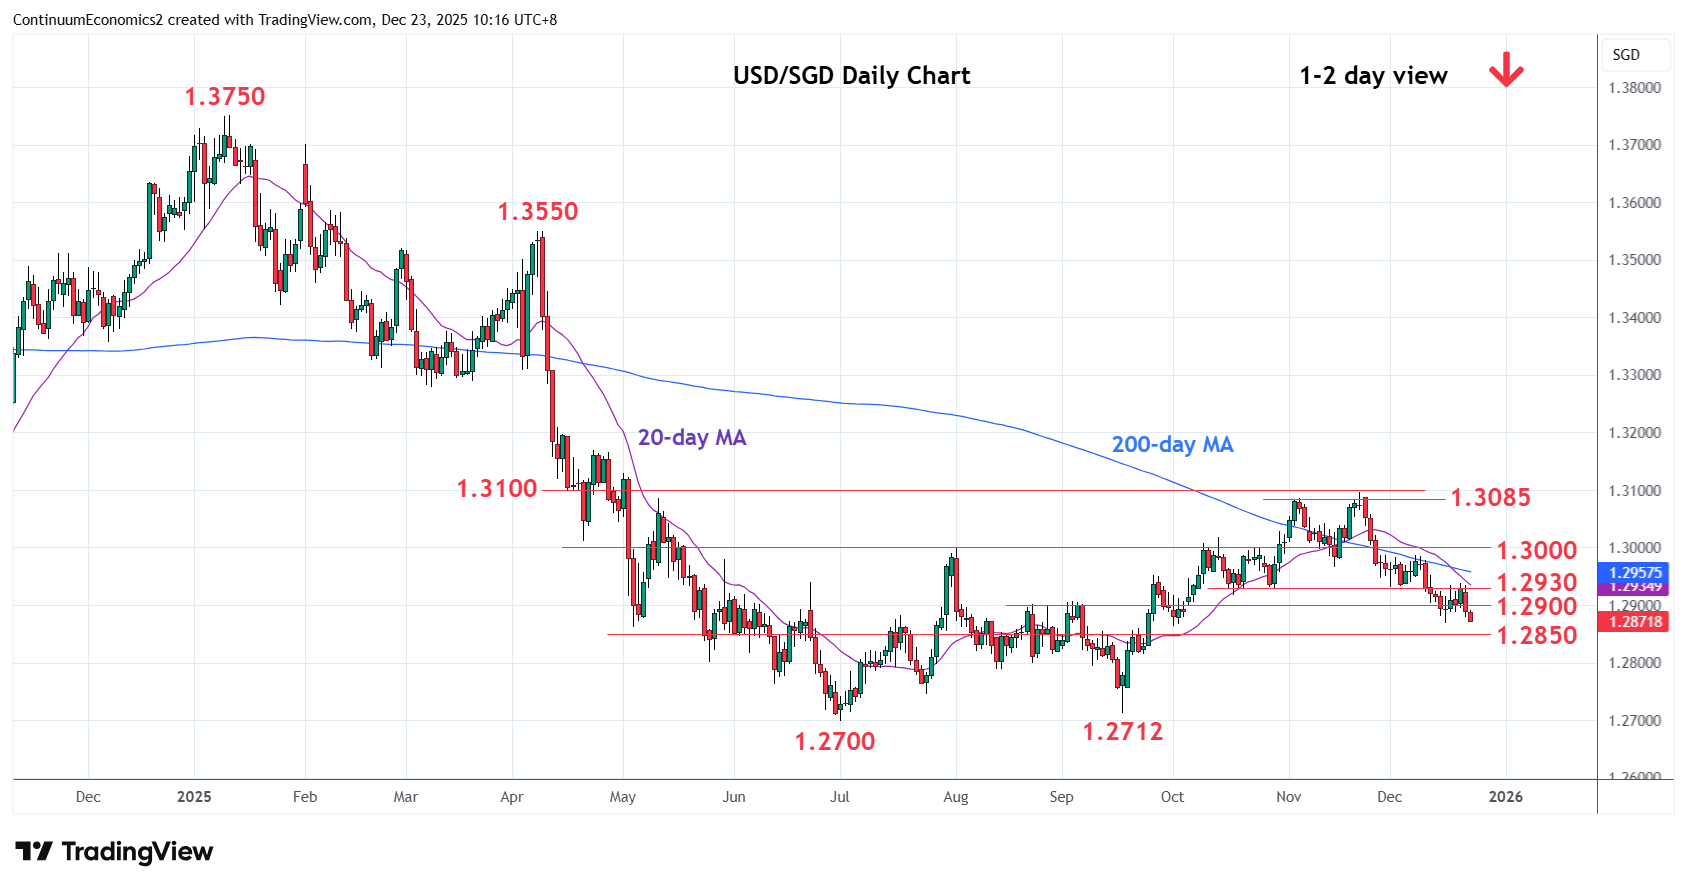
Consolidation above the 1.2900 level has given way to renewed selling pressure to retest support at the 1.2865/50 area
| Level | Comment | Level | Comment | ||||
|---|---|---|---|---|---|---|---|
| R4 | 1.3100 | ** | congestion, 38.2% | S1 | 1.2865/50 | * | 1 Oct low, 61.8% |
| R3 | 1.3085 | * | 12 May high | S2 | 1.2800 | ** | May low, congestion |
| R2 | 1.2980/00 | ** | congestion, Aug high | S3 | 1.2750 | * | congestion |
| R1 | 1.2900/30 | * | congestion | S4 | 1.2712/00 | ** | Sep, Jul YTD lows |
Asterisk denotes strength of level
02:20 GMT - Consolidation above the 1.2900 level has given way to renewed selling pressure to retest support at the 1.2865/50 area and 61.8% Fibonacci level. Break here will extend losses from the 1.3085/1.3100 November highs and see room to the 1.2800, May low and congestion area. Below this will expose the 1.2712/1.2700, September/July lows to retest. Break here will extend the 2020 year high to retrace gains from the 2011 low. Meanwhile, resistance at the 1.2900/30 area is expected to cap and sustain losses from the November high.