Published: 2026-01-07T04:56:22.000Z
Chart USD/INR Update: Extending pullback from 90.2900 high
1
Turned lowered from the 90.2900 high as corrective bounce give way to renewed selling pressure
| Level | Comment | Level | Comment | |||||
|---|---|---|---|---|---|---|---|---|
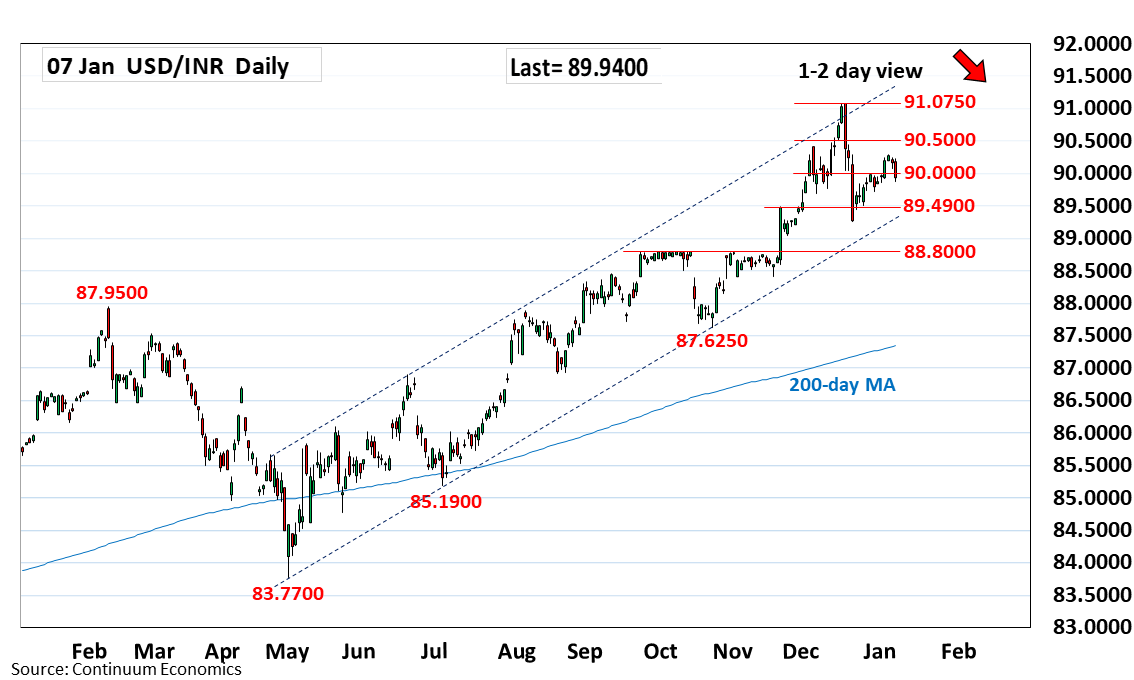
| R4 | 91.0750 | ** | 16 Dec 2025 record high | S1 | 89.7200 | * | 30 Dec low | |
| R3 | 90.5000 | * | congestion | S2 | 89.4900 | * | 21 Nov high | |
| R2 | 90.4200 | * | 4 Dec high | S3 | 89.2500 | ** | Dec low | |
| R1 | 90.2900 | ** | 5 Jan high | S4 | 89.0000 | figure |
Asterisk denotes strength of level
04:50 GMT - Turned lowered from the 90.2900 high as corrective bounce give way to renewed selling pressure. Pullback see prices unwinding overbought intraday and daily studies studies and below the 90.0000 level see room for extension to the 89.7200 anbd 89.4900 support. Below these will return focus to the 89.2500, December low. Break of the latter will open up room for deeper pullback to the 89.0000 level and strong support at 88.8000, September high. Meanwhile, resistance at 90.2900 high now expected to cap and sustain losses from the 91.0750, all-time high.