Published: 2026-04-17T04:27:41.000Z
Chart USD/IDR Updates: Fresh historic high
4
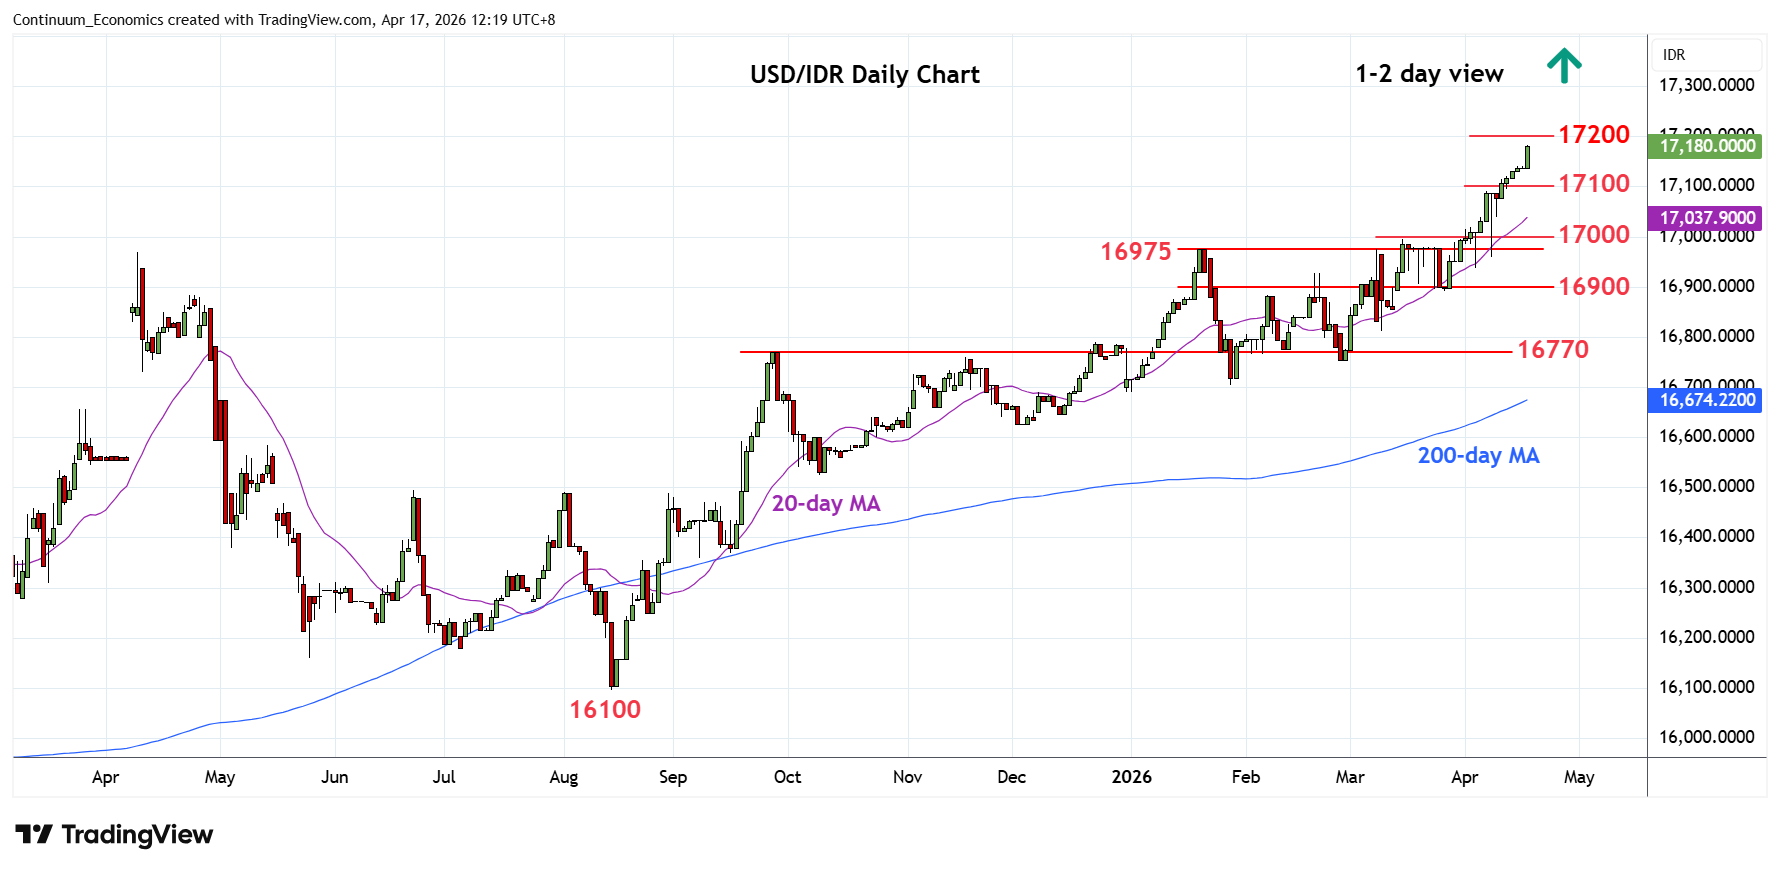
Still pressuring the upside with gains reaching fresh all-time high at 17182
| Levels | Imp | Comment | Levels | Imp | Comment | |||
|---|---|---|---|---|---|---|---|---|
| R4 | 18000 | figure | S1 | 17100 | * | congestion | ||
| R3 | 17600 | projection | S2 | 17040/00 | ** | 9 Apr low, congestion | ||
| R2 | 17200 | projection | S3 | 16975 | * | Jan high | ||
| R1 | 17182 | intraday high | S4 | 16900 | * | congestion |
Asterisk denotes strength of level
04:25 GMT - Still pressuring the upside with gains reaching fresh all-time high at 17182 and scope seen for extension to 17200 projection target. Higher still, will see scope to 17400 but overbought daily and weekly studies caution corrective pullback. Meanwhille, support is raised to the 17100 congestion which should underpin. Would take break here to ease the upside pressure and open up room for deeper corrective pullback to strong support at the 17040/17000 congestion and extending to 16975, January high.