Chart EUR/CAD Update: Consolidating test of strong resistance
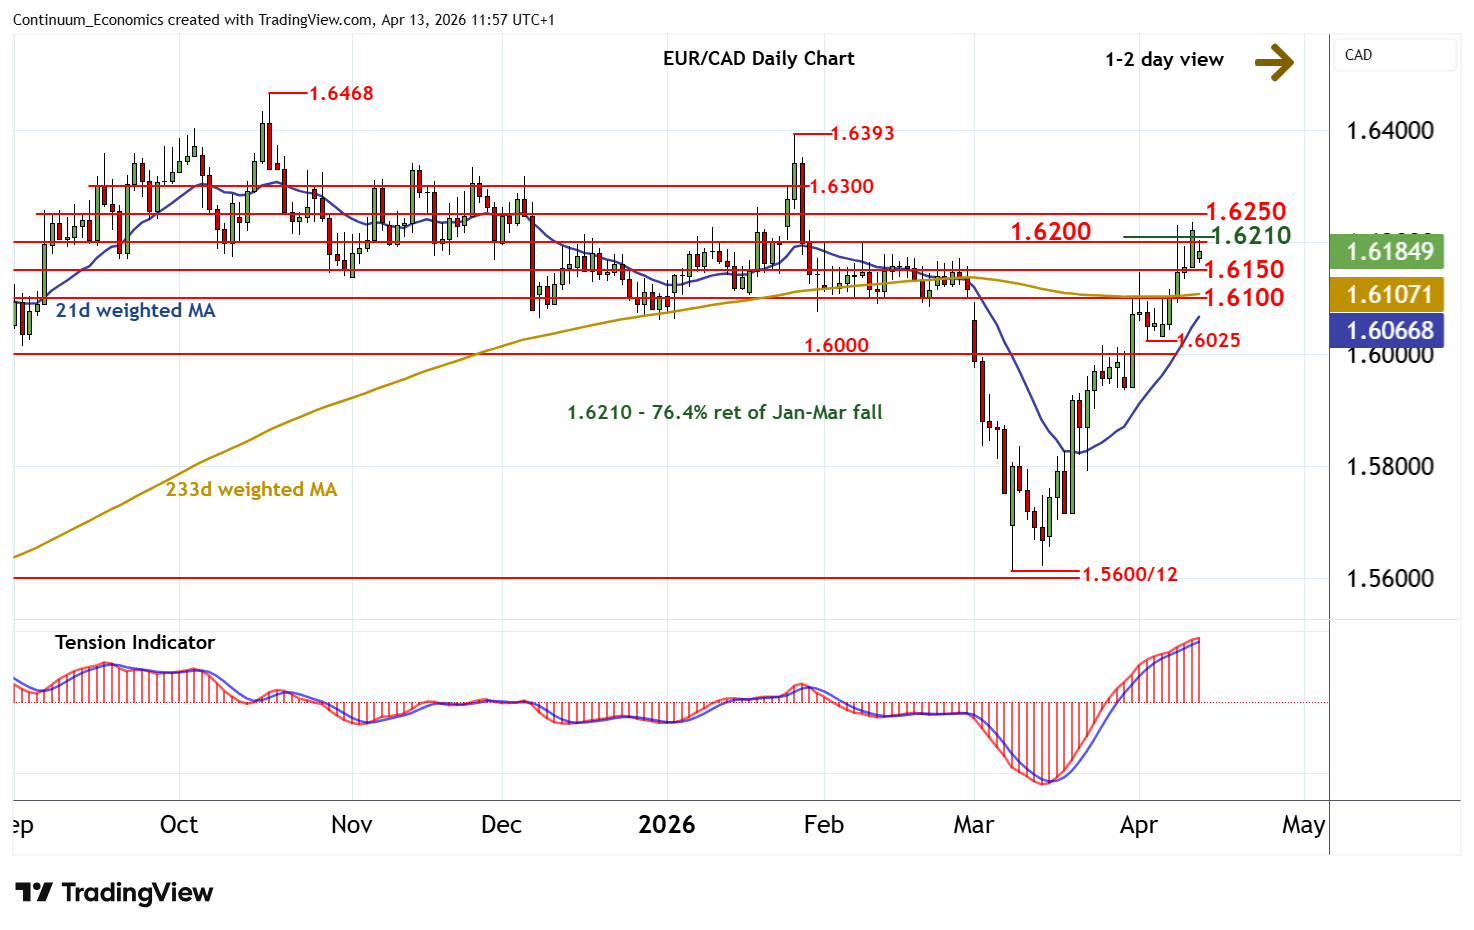
The anticipated break above strong resistance at congestion around 1.6200 and the 1.6210 Fibonacci retracement has been pushed back from beneath 1.6250
| Level | Comment | Level | Comment | |||||
|---|---|---|---|---|---|---|---|---|
| R4 | 1.6393 | ** | 27 Jan YTD high | S1 | 1.6150 | * | congestion | |
| R3 | 1.6300 | * | congestion | S2 | 1.6100 | ** | break level | |
| R2 | 1.6250 | congestion | S3 | 1.6025 | * | recent lows | ||
| R1 | 1.6200/10 | ** | congestion; 76.4% ret | S4 | 1.6000 | ** | congestion |
Asterisk denotes strength
11:30 BST - The anticipated break above strong resistance at congestion around 1.6200 and the 1.6210 Fibonacci retracement has been pushed back from beneath 1.6250, as intraday studies and overbought daily stochastics turn down, with prices currently trading around 1.6185. A move down to congestion support at 1.6150 cannot be ruled out. But the rising daily Tension Indicator and positive weekly charts should limit any tests in renewed buying interest/consolidation. A close beneath here, however, would add weight to sentiment and extend losses towards 1.6100. Following cautious/corrective trade, a fresh test higher is looked for. A close back above 1.6200/10 will extend March gains towards congestion around 1.6250. However, deteriorating longer-term charts could limit any further gains in profit-taking towards 1.6300.