Published: 2026-05-07T02:33:21.000Z
Chart USD/SGD Update: Weighing on 1.2667 April low
-
Sharply lower as consolidation around 1.2750 gave way to selling pressure through the 1.2700 level to retest the 1.2667, April low
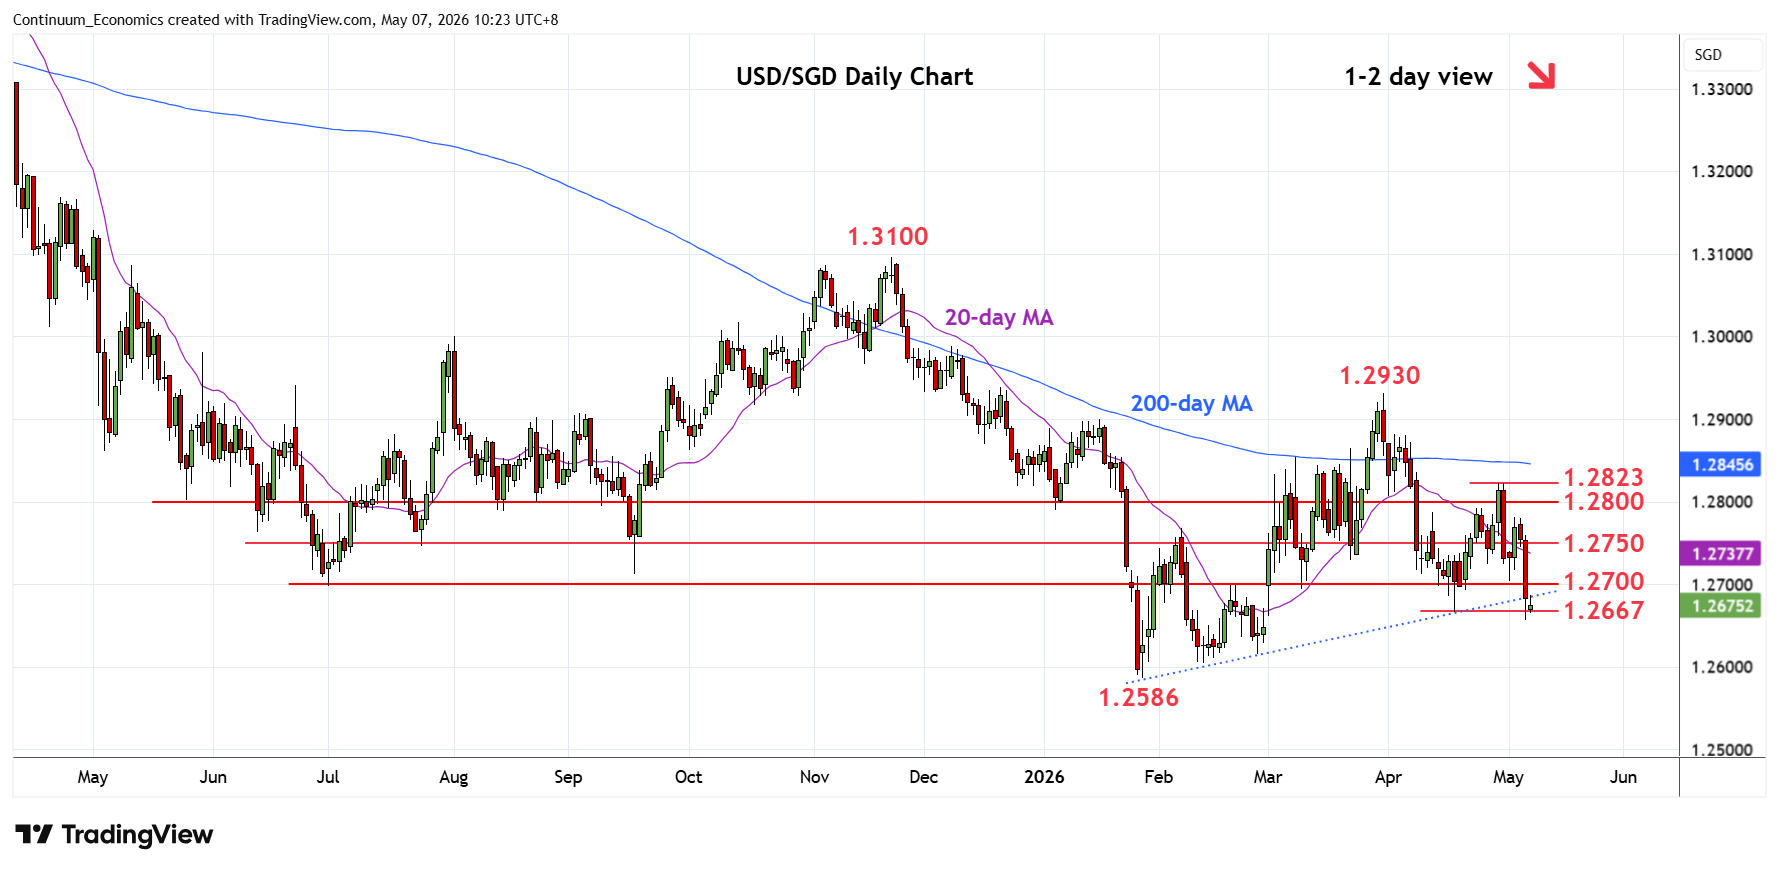
| Level | Comment | Level | Comment | ||||
|---|---|---|---|---|---|---|---|
| R4 | 1.2823 | ** | 29 Apr high | S1 | 1.2667 | ** | Apr low |
| R3 | 1.2800 | * | congestion | S2 | 1.2650 | * | congestion |
| R2 | 1.2750 | * | congestion | S3 | 1.2586 | ** | 28 Jan YTD low |
| R1 | 1.2700 | * | congestion | S4 | 1.2550 | * | congestion |
Asterisk denotes strength of level
02:25 GMT - Sharply lower as consolidation around 1.2750 gave way to selling pressure through the 1.2700 level to retest the 1.2667, April low. Consolidation here is expected to give way to fresh selling pressure later to see extension to the 1.2600 level then the 1.2586, 28 January current year low. Reaction at the latter can be expected but a later break cnnot be ruled out and see extension to 1.2550/1.2500 area. Meanwhile, resistance is lowered to the 1.2700 level which is expected to cap and sustain losses from the 1.2823, 29 April high.