Published: 2026-02-26T17:30:06.000Z
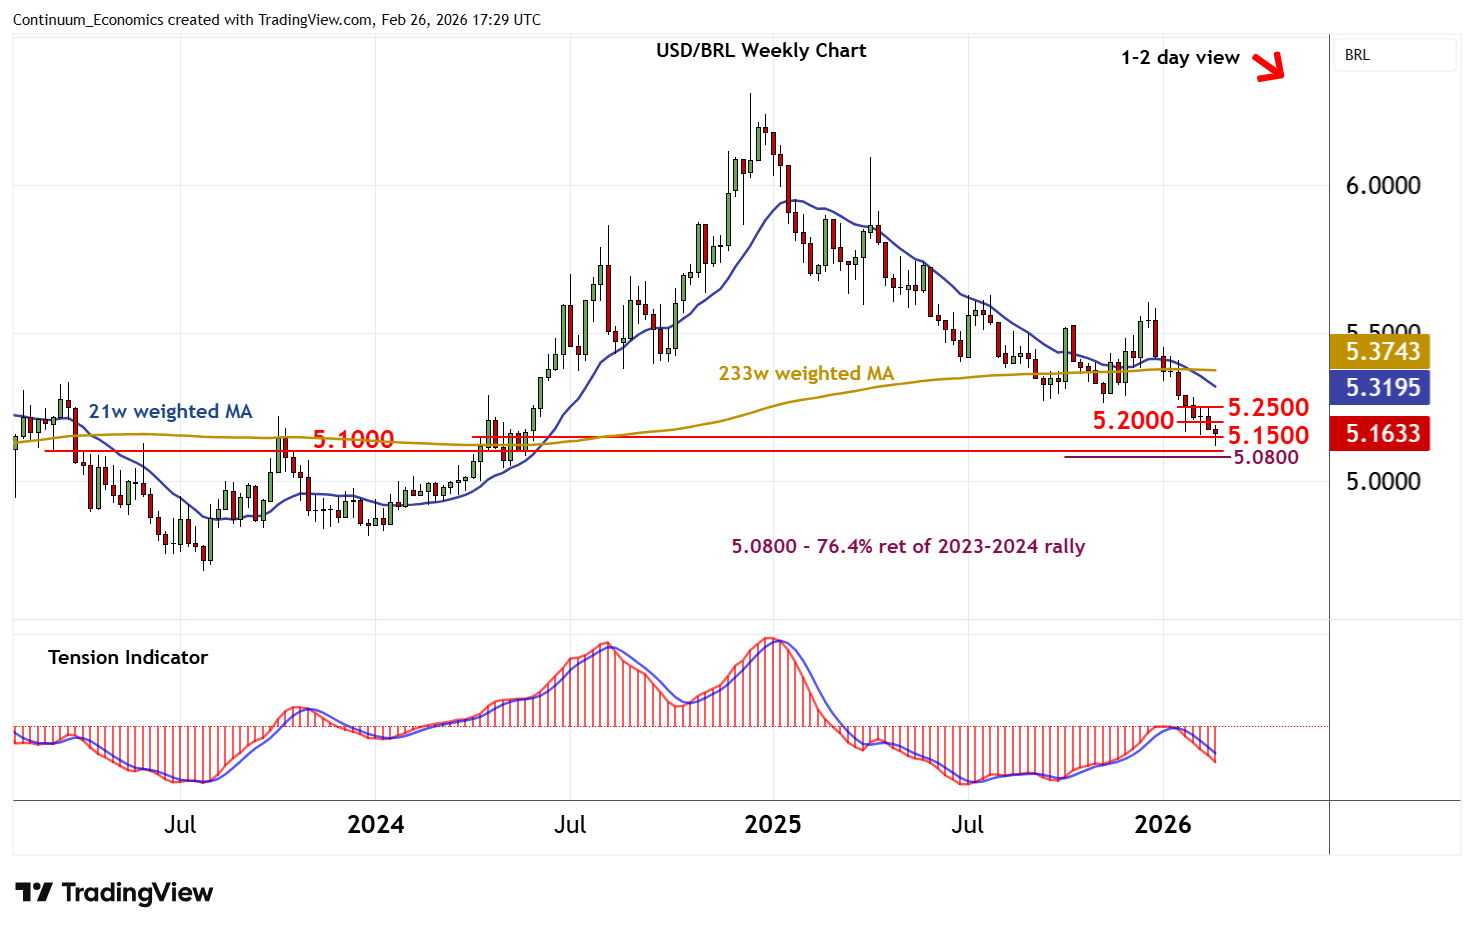
Chart USD/BRL Update: Sharp bounce from fresh 2026 year low
2
Anticipated losses have posted a fresh 2026 year low below 5.1500 at 5.1200
| Levels | Imp | Comment | Levels | Imp | Comment | |||
|---|---|---|---|---|---|---|---|---|
| R4 | 5.3000 | ** | congestion | S1 | 5.1500 | ** | congestion | |
| R3 | 5.2840 | * | 5 Feb (w) high | S2 | 5.1200 | ** | 25 Feb YTD low | |
| R2 | 5.2500 | * | congestion | S3 | 5.1000 | ** | congestion | |
| R1 | 5.2000 | * | congestion | S4 | 5.0800 | ** | 76.4% ret of 2023-2024 rally |
Asterisk denotes strength of level
16:40 GMT - Anticipated losses have posted a fresh 2026 year low below 5.1500 at 5.1200, before posting a bounce back above congestion support at 5.1500. Oversold daily stochastics are turning higher, suggesting room for continuation towards congestion resistance at 5.2000. But the negative daily Tension Indicator and bearish weekly and monthly charts should limit any initial tests in fresh consolidation. Meanwhile, support remains strong down to the 5.0800 Fibonacci retracement and congestion around 5.1000. This range should underpin any immediate tests lower.