Published: 2025-10-31T05:31:11.000Z
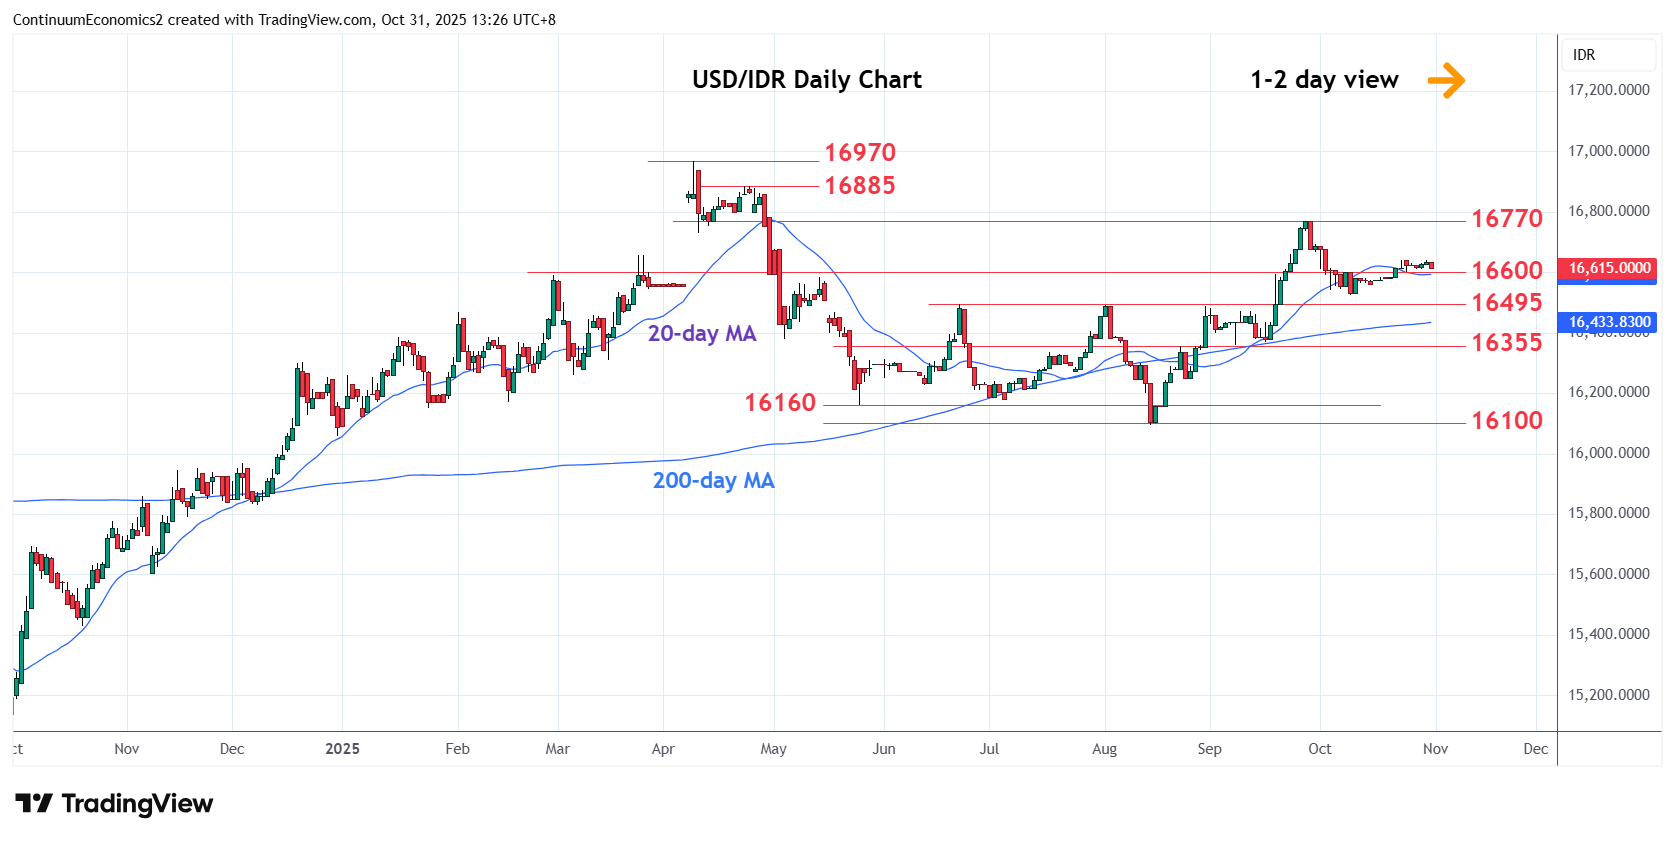
Chart USD/IDR Updates: Extend consolidation within 16640/16600 range
5
Little change, as prices extend consolidation within the 16640/16600 range area
| Levels | Imp | Comment | Levels | Imp | Comment | |||
|---|---|---|---|---|---|---|---|---|
| R4 | 16800 | * | congestion | S1 | 16600 | * | congestion | |
| R3 | 16770 | ** | 26 Sep high | S2 | 16525 | * | 9 Oct low | |
| R2 | 16700 | * | figure | S3 | 16495 | ** | Jun high | |
| R1 | 16640 | * | 23 Oct high | S4 | 16355/350 | * | 61.8%, congestion |
Asterisk denotes strength of level
05:30 GMT - Little change, as prices extend consolidation within the 16640/16600 range area. Daily studies are mixed and suggest further ranging action here. Would take break of the 16600 level to open up room for deeper pullback to retrace gains from the 16525 low. Below this will extend the broader losses from the 16770 high retrace the August/September rally and see room to strong support at the 16495, June-August range highs. Meanwhile, resistance at the 16640 high expected to cap and limit corrective bounce.