Published: 2026-02-03T08:09:17.000Z
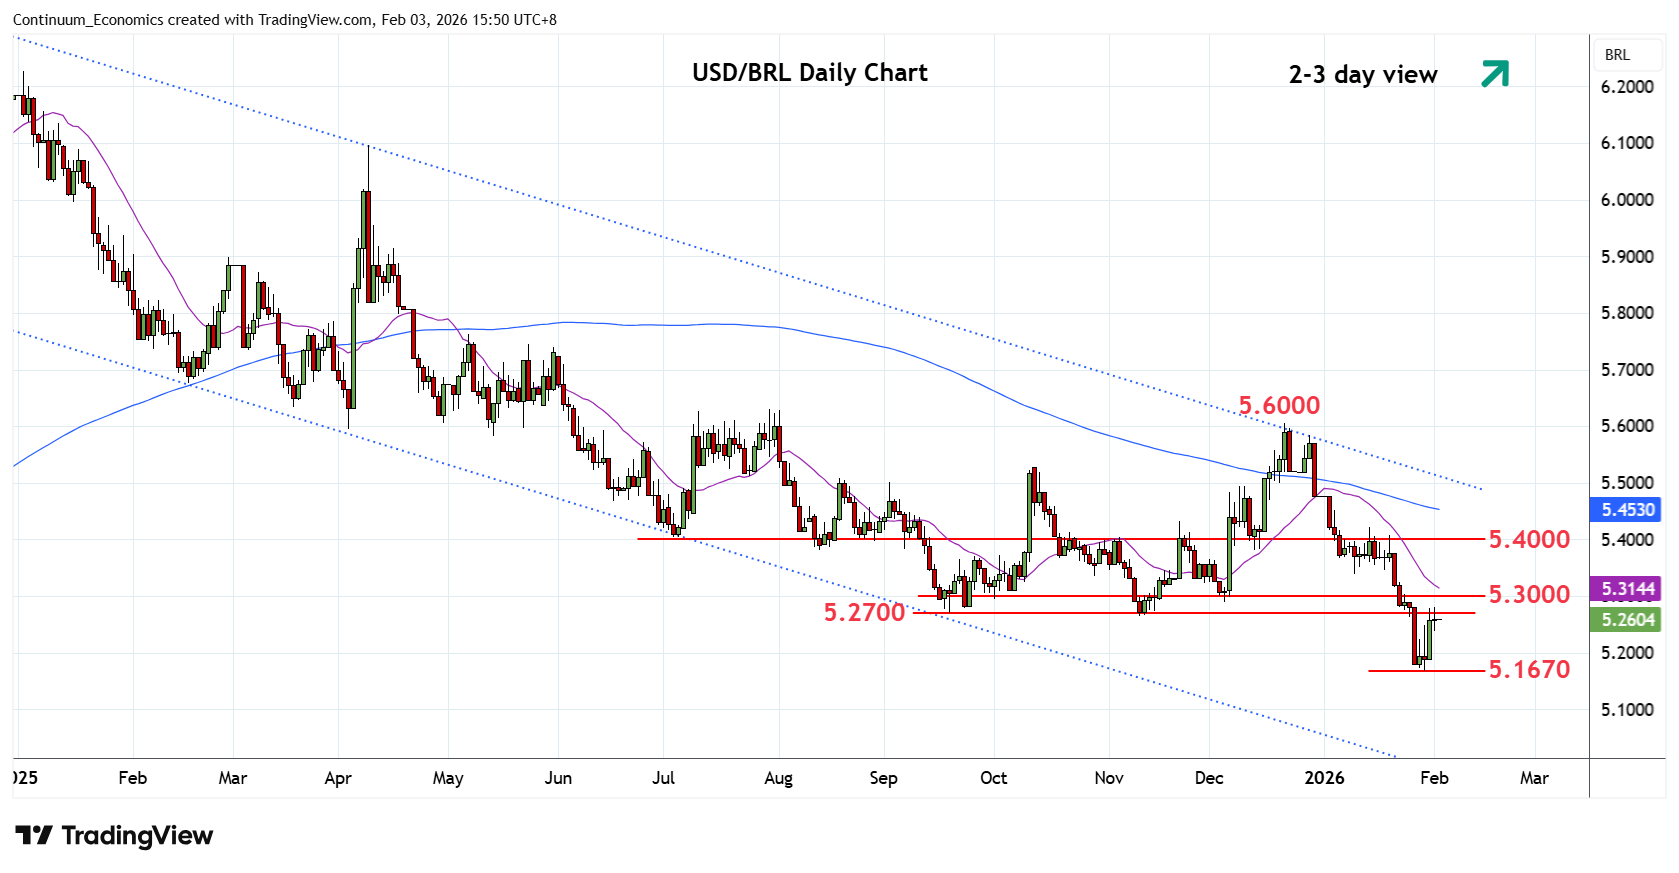
Chart USD/BRL Update: Extend corrective bounce from January low
2
Turned up from the 5.1670 January current year low to reach resistance at the 5.2700, 2025 year low
| Levels | Imp | Comment | Levels | Imp | Comment | |||
|---|---|---|---|---|---|---|---|---|
| R4 | 5.4000 | * | congestion | S1 | 5.2000 | congestion | ||
| R3 | 5.3500 | * | congestion | S2 | 5.1670 | ** | 29 Jan YTD low | |
| R2 | 5.3000 | * | congestion | S3 | 5.1500 | * | congestion | |
| R1 | 5.2700 | ** | Sep/Nov 2025 year lows | S4 | 5.1000 | ** | figure |
Asterisk denotes strength of level
08:00 GMT - Turned up from the 5.1670 January current year low see prices unwinding oversold daily studies to reach resistance at the 5.2700, 2025 year low. Higher will see room for stronger gains to retrace losses from the 5.6000 December high to the 5.3000/5.3500 congestion area. Corrective bounce are expected to meet with renewed selling pressure later to retest the 5.2000 level and 5.1670 low. Below these will see room to further extend losses within the bearish channel from the December 2024 year high to congestion at 5.1500 and the 5.1000 figure.