Published: 2025-12-12T02:48:11.000Z
Chart USD/SGD Update: Room for further losses
1
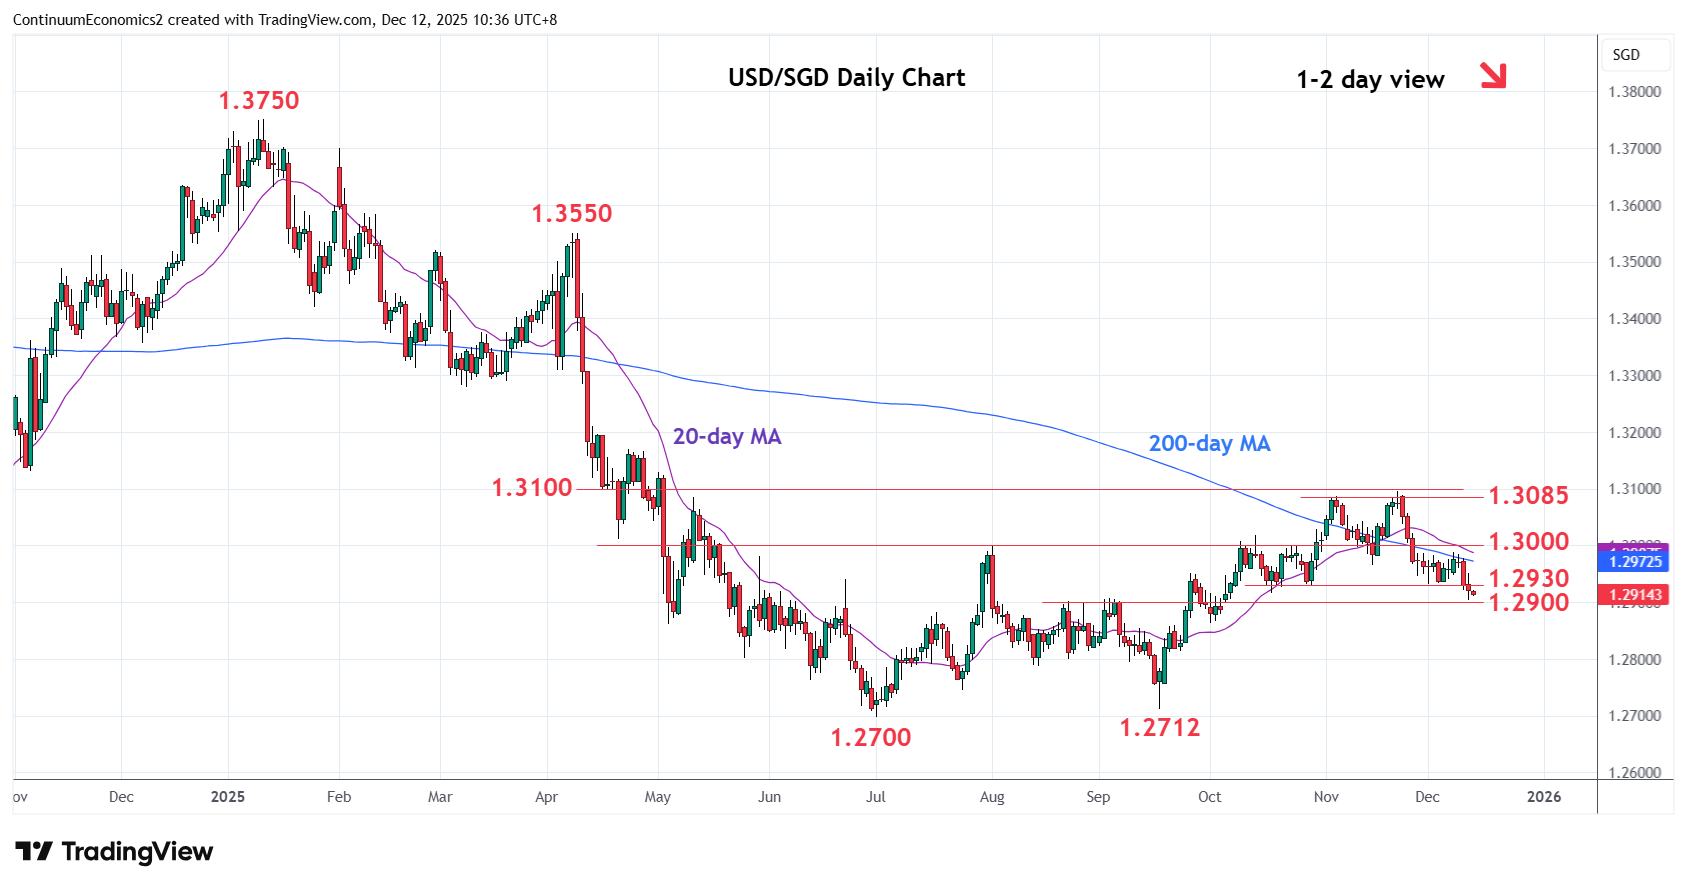
Break of the 1.2930 support see prices extending pullback from the 1.2985/1.3000 area to pressure support at 1.2917/00
| Level | Comment | Level | Comment | ||||
|---|---|---|---|---|---|---|---|
| R4 | 1.3130 | * | May high | S1 | 1.2900 | ** | congestion, 50% |
| R3 | 1.3100 | ** | congestion, 38.2% | S2 | 1.2865/50 | * | 1 Oct low, 61.8% |
| R2 | 1.3085 | * | 12 May high | S3 | 1.2800 | ** | May low, congestion |
| R1 | 1.3000 | ** | Aug high, congestion | S4 | 1.2750 | * | congestion |
Asterisk denotes strength of level
02:40 GMT - Break of the 1.2930 support see prices extending pullback from the 1.2985/1.3000 area to pressure support at the 1.2917/00 congestion and 50% Fibonacci level. Negative daily and weekly studies weigh and break here will see room to further retrace gains from the July/September lows to support at 1.2865 October low and the 1.2850, 61.8% Fibonacci level. Lower still, will see room to 1.2800 level. Meanwhile, resistance at the 1.2985/1.3000 area is expected to cap and sustain losses from the November highs.