Published: 2026-02-02T02:37:53.000Z
Chart USD/CNH Update: Room for stronger corrective gains
-
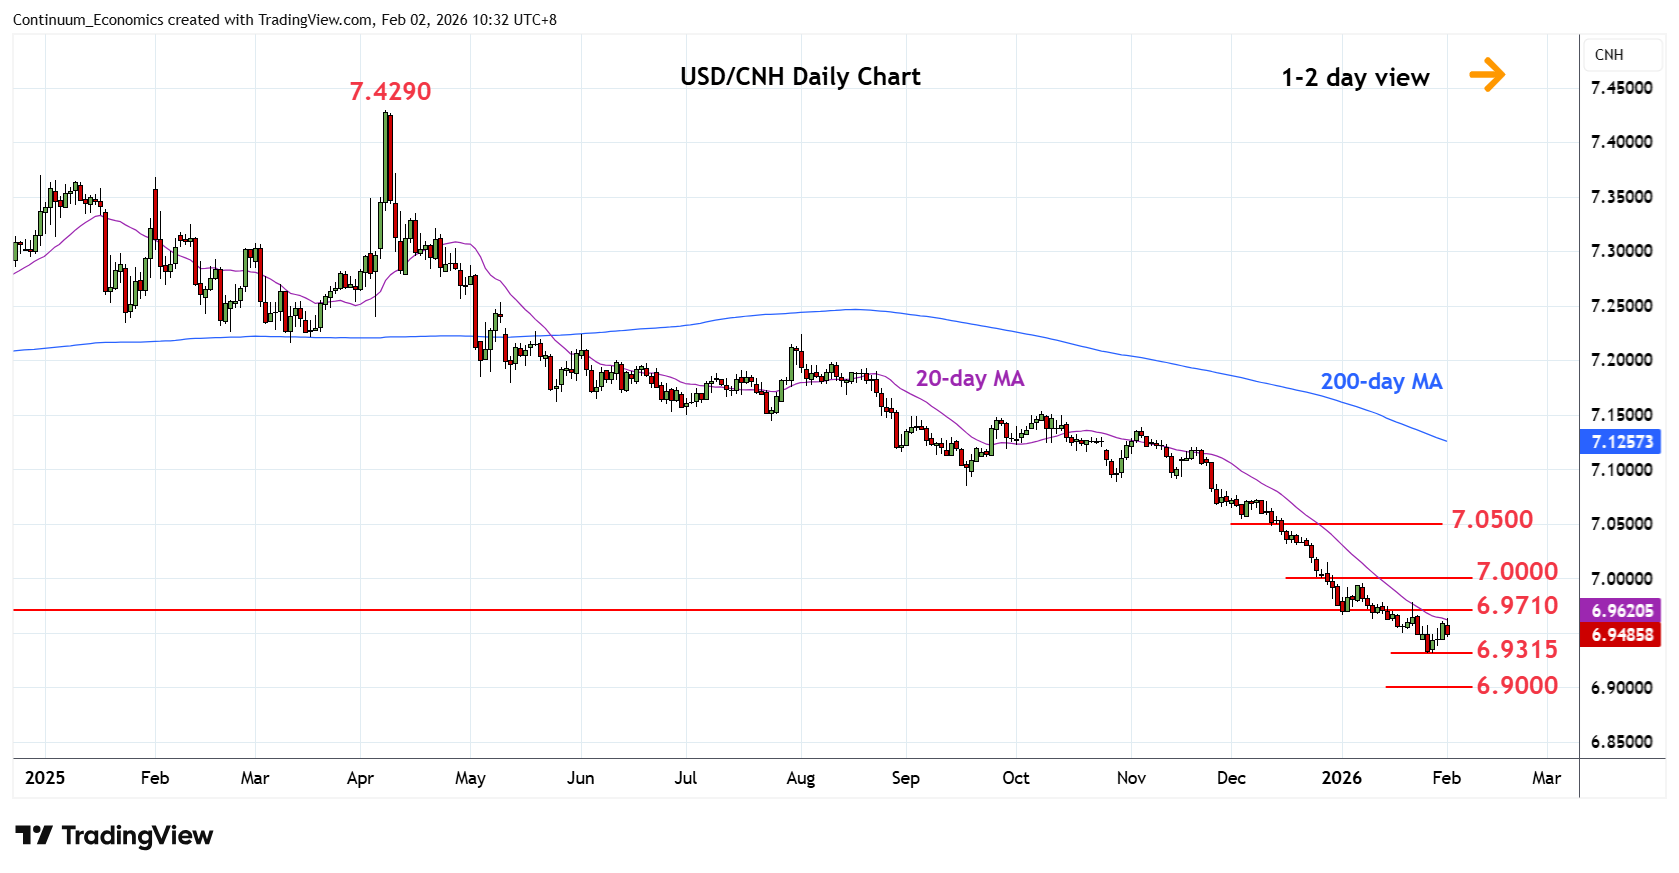
Edged up from the 6.9315 low as prices consolidate losses from the 6.9960 January high to reach the 6.9600 level
| Level | Imp | Comment | Level | Imp | Comment | |||
|---|---|---|---|---|---|---|---|---|
| R4 | 7.0150 | 29 Dec high | S1 | 6.9315 | * | 27 Jan YTD low | ||
| R3 | 6.9960/00 | ** | 8 Jan high, congestion | S2 | 6.9300 | * | congestion | |
| R2 | 6.9710 | * | Sep 2024 year low | S3 | 6.9000 | ** | congestion | |
| R1 | 6.9600 | * | congestion | S4 | 6.8700 | * | 76.4% 2023/2025 rally |
Asterisk denotes strength of level
02:35 GMT - Edged up from the 6.9315 low as prices consolidate losses from the 6.9960 January high to reach the 6.9600 level. Positive daily chart suggest scope for stronger bounce to unwind oversold daily studies. Above the 6.9600 congestion will see room for stronger bounce to resistance at 6.9710 low and the 6.9960/7.0000 congestion area. Meanwhile, support at the 6.9315 low should underpin. A later break here will extend losses from the 7.4290 2025 year high and see room to the 6.9000 figure and 6.8700, 76.4% Fibonacci level.