This week's five highlights
Iran War Scenarios
U.S. February Core CPI has slowed, but inflation not yet defeated
UK GDP More Gloom
DXY Fresh year highs
USD/JPY At intervention Level
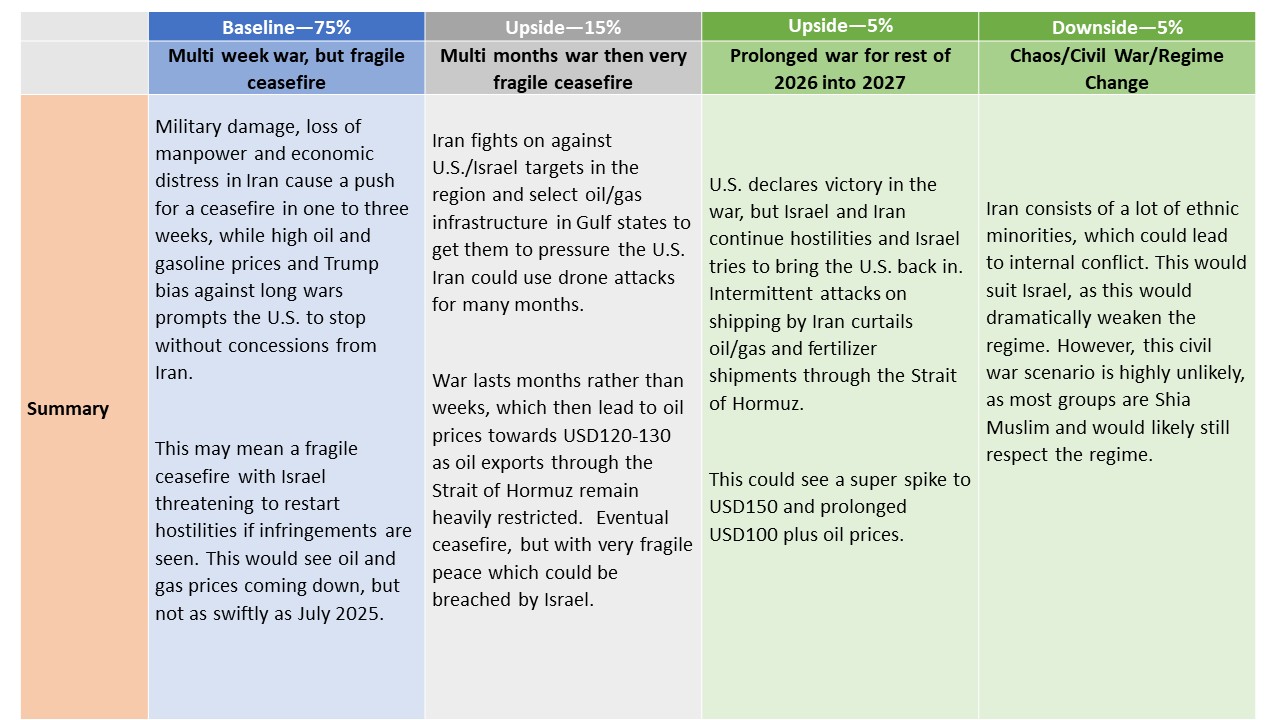
Our central scenario (75%) remains a multi-week war in Iran. Trump loathing of long wars and high gasoline prices prompts U.S. to declare victory before end of March. Israel and Iran would most likely agree an effective ceasefire. The ceasefire would be fragile, however, as it would likely not involve concessions from Iran’s new hard-line leader, while potential Israeli hostilities could breach the ceasefire. We would see WTI at USD80-85 by April and USD70-75 by June. The main alternative scenario is a multi-month war (15%), which could squeeze oil prices up to USD120-130.
With war in an intense phase, a lot of uncertainty exists over likely outcomes. However, in one to two more weeks, the damage to Iran’s missile and offensive capabilities will likely mean that initial military objectives could be partially or fully achieved. We highlight below a number of scenarios that could occur, with some broad estimate of probability – with the understanding that these will likely change based on decisions in Iran/U.S. and Israel.

February CPI is in line with expectations at 0.3% overall, 0.2% ex food and energy, with the respective gains before rounding being 0.267% and a reasonably subdued 0.216%. Yr/yr rates are unchanged at 2.4% overall and 2.5% ex food and energy. The data is not alarming but inflationary pressures remained above target even before the latest oil price spike. Energy rose by 0.8% with gasoline up by 0.6% with a strong rise looking assured in March. Within the energy detail there was also a surge of 11.1% in fuel oil after a 5.7% January decline. Food was on the firm side of trend, rising by 0.4%.
Commodities less food and energy rose by 0.1% after two flat months. Used autos remain a restraint but less so, falling by 0.4% after declines of 1.8% in January and 0.9% in December. Apparel saw a strong month at 1.3% but information technology commodities fell by 3.1%.
Figure: GDP Growth Hardly Strong and With Increasing Downside Risks?

Fresh downside surprises were the story from the January GDP numbers. Expectations that the economy would enjoy a further successive rise, thereby providing the best three-month showing in two years were dashed as GDP instead stagnated. Weakness was broad-based but most evident in private services and in spite of a bunce in retailing. But as is familiar with recent UK real economy data, it now looks more likely that growth this quarter will be no better than the 0.1% q/q seen in Q4, less than consensus and BoE thinking for this quarter. Moreover, there may be downside risks as activity and sentiment will, of course, be hit by events in the Middle East. Even without the Middle East impact we were suggesting a sub-consensus 2026 GDP picture of 0.8% which now has even greater downside risks attached.
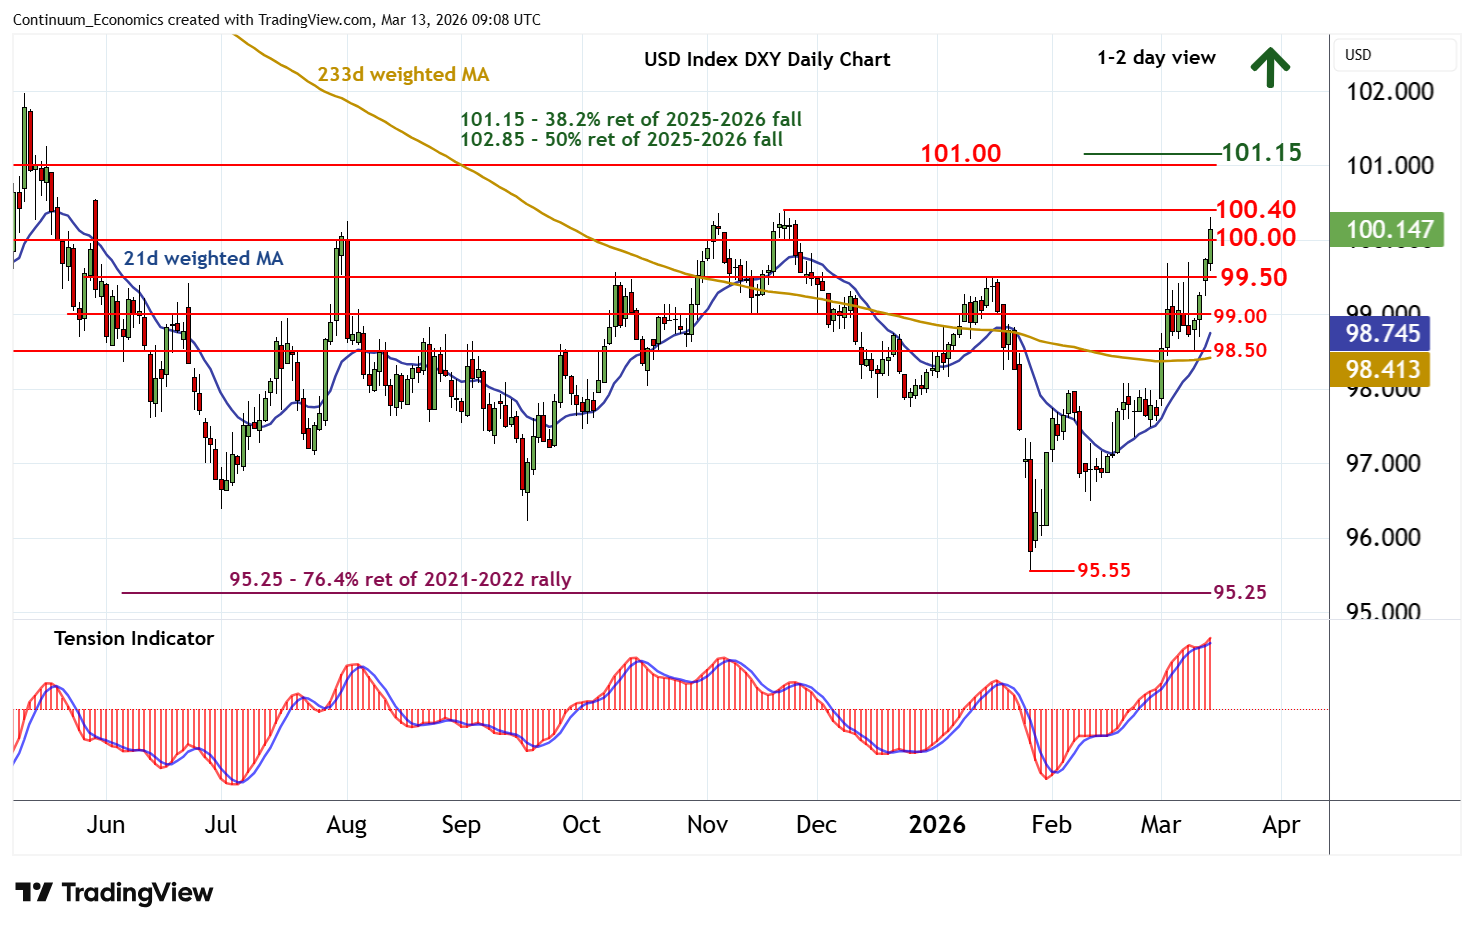
Minor consolidation around 99.75 has given way to anticipated gains, with the break above 100.00 posting fresh 2026 year highs just beneath critical resistance at the 100.40 monthly high of 21 November. Daily readings continue to rise and broader weekly charts are positive, highlighting room for still further strength in the coming sessions. A close above 100.40 will confirm a significant low in place at the 95.55 current year low of 27 January, and extend late-January gains towards resistance at congestion around 101.00 and the 101.15 multi-month Fibonacci retracement. Already overbought daily stochastics could limit any initial tests of this range in profit-taking/consolidation. Meanwhile, a close back below 100.00 would help to stabilise sentiment and prompt consolidation above congestion around 99.50.

USD/JPY continue its rally on stronger USD amid geopolitical uncertainty. As the pair quickly approaches 160 figure, verbal intervention surfaces expectedly. Japan Finance Minister Katayama signaled readiness to act in foreign exchange markets if necessary, a classic rhetoric of jawboning.
Break above the 158.90 high of Monday has seen gains to retest 159.45, January current year high. Positive daily and weekly studies keeps pressure on the upside and suggest scope for break here to further extend gains within the bullish channel from the April low. Clearance will see scope to target the 160.00 figure where reaction can be expected. Meanwhile, support is raised to the 158.00/157.65 area which should underpin. Would take break here to fade the upside pressure and retrace gains from the 152.27/152.10 February/January lows.