Published: 2026-05-08T06:48:38.000Z
Chart USD/TWD Update: Room to extend March losses
1
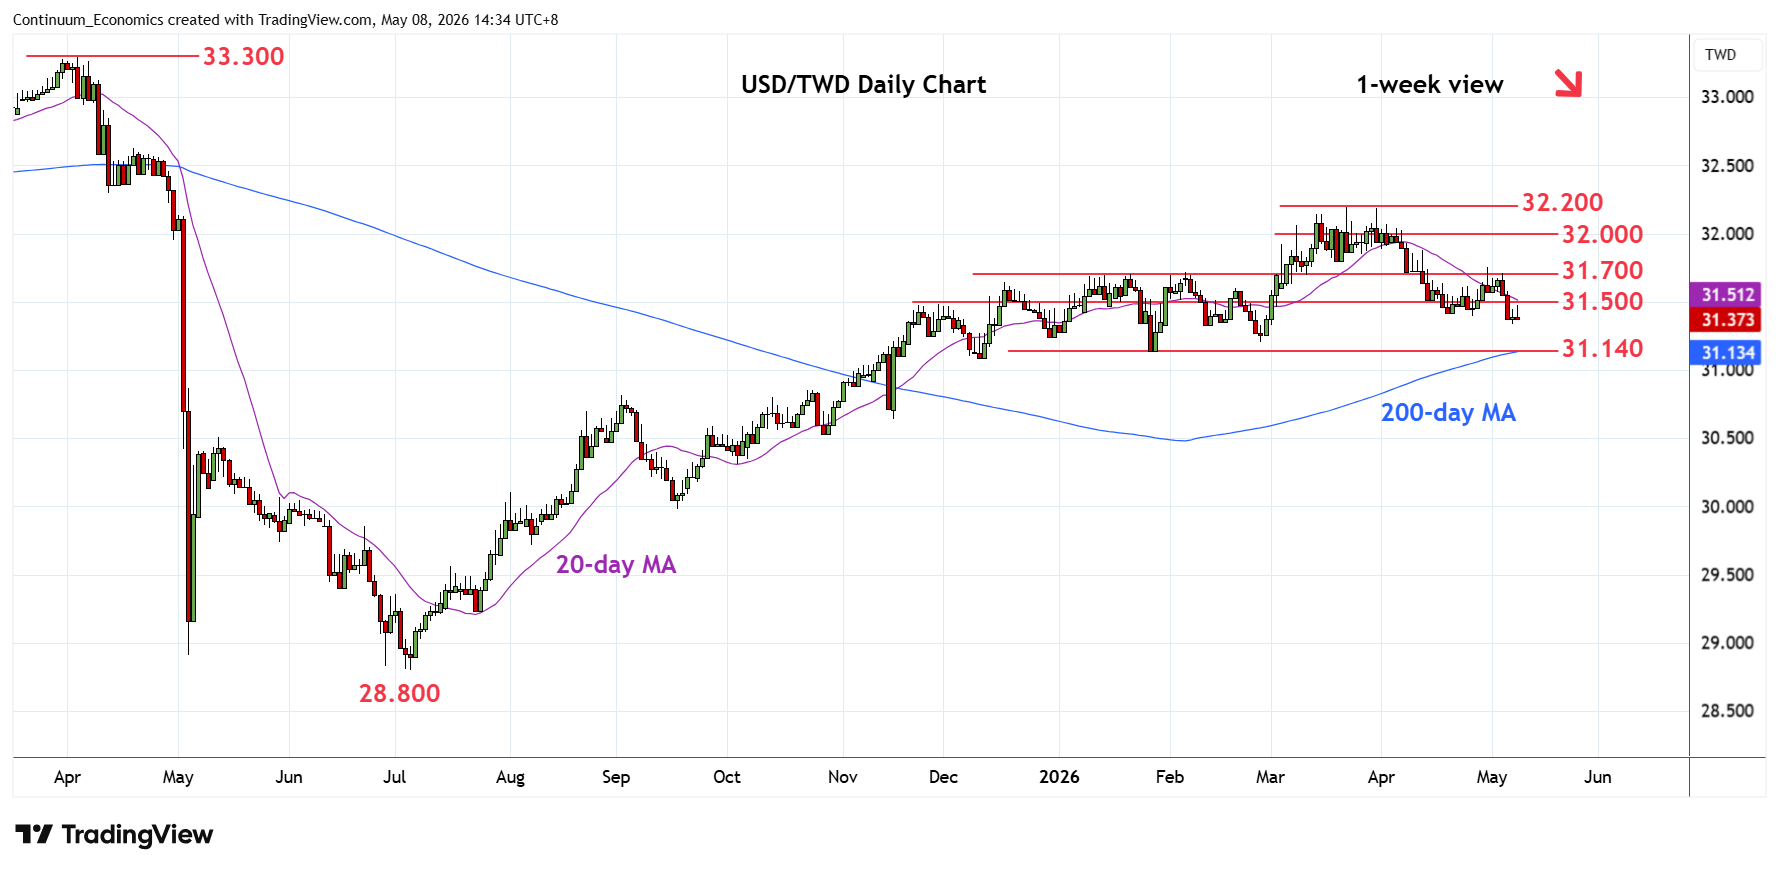
Steadied at the 31.340 Thursday's low but pressure remains on the downside
| Levels | Imp | Comment | Levels | Imp | Comment | |||
|---|---|---|---|---|---|---|---|---|
| R4 | 32.000 | * | figure | S1 | 31.200 | * | Feb low | |
| R3 | 31.800 | * | congestion | S2 | 31.140 | ** | 27 Jan YTD low | |
| R2 | 31.700 | ** | Jan, Feb highs | S3 | 31.000 | * | figure | |
| R1 | 31.500 | * | congestion | S4 | 30.900 | * | 38.2% 2025/Mar rally |
06:40 GMT - Steadied at the 31.340 Thursday's low but pressure remains on the downside and see scope for break here to extend losses from the 32.200 March current year high. Lower will see room to strong support at 31.200 February low and the 31.140 January YTD low. Would expected reaction on retest of the latter but negative daily studies suggest scope for break to retrace gains from the July 2025 year low. Lower will see room to the 31.000 level and 30.900, 38.2% Fibonacci retracement. Meanwhile, resistance at the 31.500/31.700 congestion area is expected to cap and sustain losses from 32.200 high.