Published: 2025-11-21T05:01:23.000Z
Chart USD/INR Update: Choppy below 88.8000 high
-
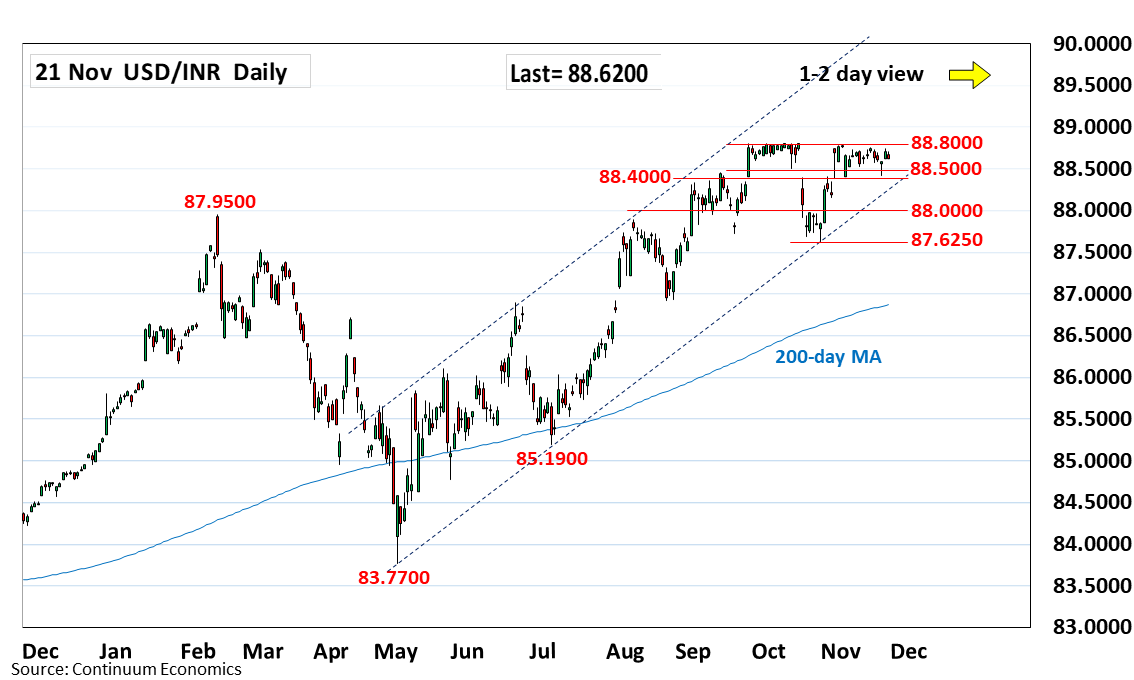
Little change, as prices extend choppy trade below the 88.8000, 30 September all-time high
| Level | Comment | Level | Comment | |||||
|---|---|---|---|---|---|---|---|---|
| R4 | 89.5000 | * | projection | S1 | 88.4000 | * | 28 Oct high | |
| R3 | 89.2000 | * | projection | S2 | 88.1550 | * | 29 Oct low | |
| R2 | 89.0000 | * | figure | S3 | 88.0000 | * | congestion | |
| R1 | 88.8000 | ** | 30 Sep all-time high | S4 | 87.6250 | ** | Oct low |
Asterisk denotes strength of level
05:00 GMT - Little change, as prices extend choppy trade below the 88.8000, 30 September all-time high. However, bullish structure suggest scope for break here to extend strong gains from the 83.7700, May YTD low and the broader underlying bull trend. Clearance will see room for extension to the 89.0000 figure. Meanwhile, support at the 88.5000/88.4000 area underpin and sustain recent bounce from the October low. Would take break here to open up room for deeper pullback to retrace bounce from the 83.7700, May current year low.