Published: 2026-01-20T02:31:03.000Z
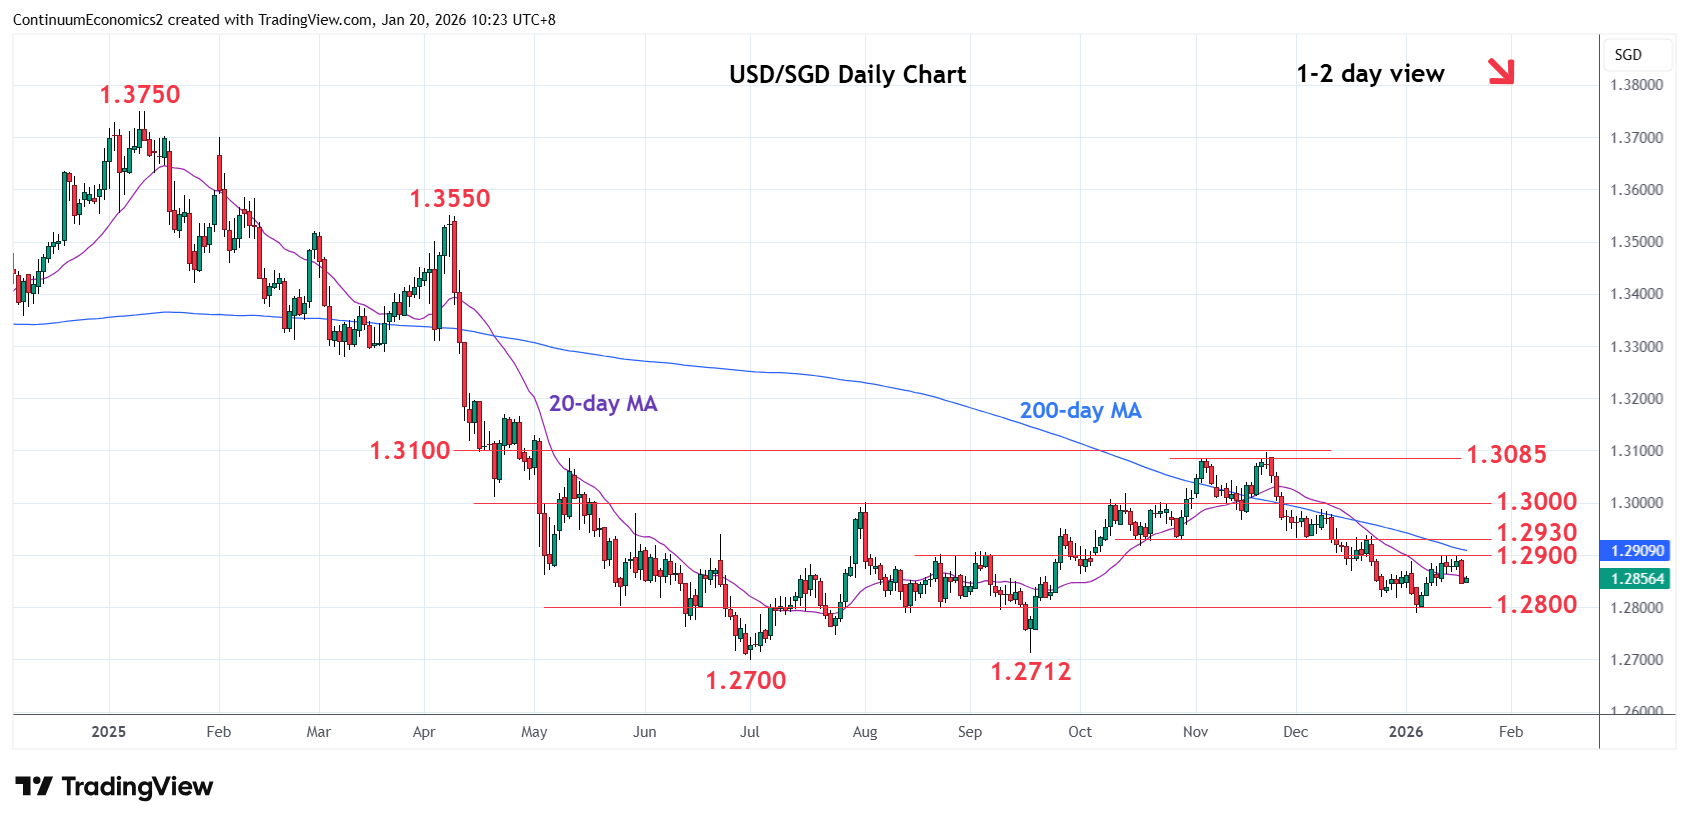
Chart USD/SGD Update: Leaning lower from test of 1.2900 resistance
-
Settled back from test of the 1.2900 resistance to consolidate at the 1.2850 support
| Level | Comment | Level | Comment | ||||
|---|---|---|---|---|---|---|---|
| R4 | 1.3085/100 | ** | 12 May high, congestion | S1 | 1.2850 | * | congestion |
| R3 | 1.2980/00 | * | congestion, Aug high | S2 | 1.2800 | * | congestion |
| R2 | 1.2930 | ** | congestion | S3 | 1.2750 | * | congestion |
| R1 | 1.2900 | * | congestion | S4 | 1.2712/00 | ** | Sep, Jul 2025 year lows |
Asterisk denotes strength of level
02:25 GMT - Settled back from test of the 1.2900 resistance to consolidate at the 1.2850 support. Daily studies have turned down from overbought areas and suggest room for deeper pullback to retest support at the 1.2800 congestion. Break here will extend the losses from the November high and see room to the 1.2750 congestion but focus will return to the 1.2712/1.2700, September/July lows. Meanwhile, break of resistsnce at the 1.2900 level is expected to cap. Would take break here to open up room for stronger gains to retrace losses from the 1.3100 November high.