Published: 2026-01-08T05:15:28.000Z
Chart USD/IDR Updates: Pressuring 16770/16790 resistance
2
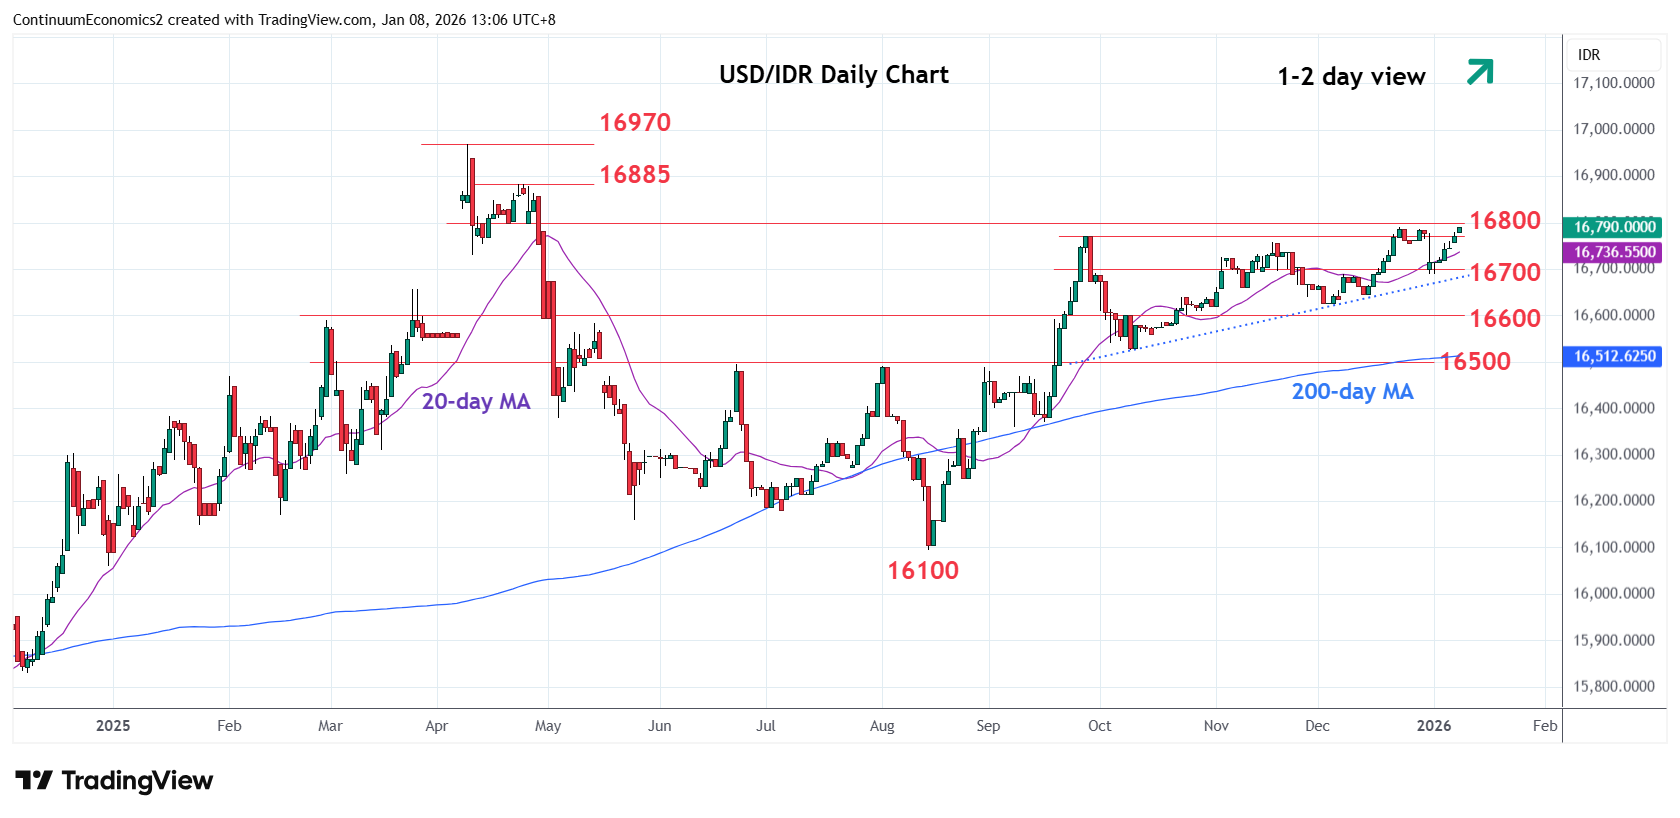
Pressing higher within the ascending triangle from the October low to retest the 16770/16790, September/December highs
| Levels | Imp | Comment | Levels | Imp | Comment | |||
|---|---|---|---|---|---|---|---|---|
| R4 | 16970 | ** | 9 Apr 2025 all-time high | S1 | 16690 | * | 8 Dec high | |
| R3 | 16885 | * | 23 Apr high | S2 | 16625 | ** | 2 Dec low | |
| R2 | 16800 | * | congestion | S3 | 16600 | * | congestion | |
| R1 | 16770/90 | ** | Nov, Dec highs | S4 | 16525 | * | Oct low |
Asterisk denotes strength of level
05:10 GMT - Pressing higher within the ascending triangle from the October low to retest the 16770/16790, September/December highs. Reaction here can be expected but a later break will see extension of the broader gains from the 16100, August 2025 year low. Clearance here and the 16800 level will see room to resistance at 16885 then the 16970, April 2025 all-time high. Meanwhile, support is raised to 16700/16690 congestion area which should underpin. Would take break here to fade the upside pressure and negate the bullish ascending triangle pattern.