Published: 2025-10-24T05:31:13.000Z
Chart USD/MYR Update: Drifting narrowly below 4.2300/40 resistance
1
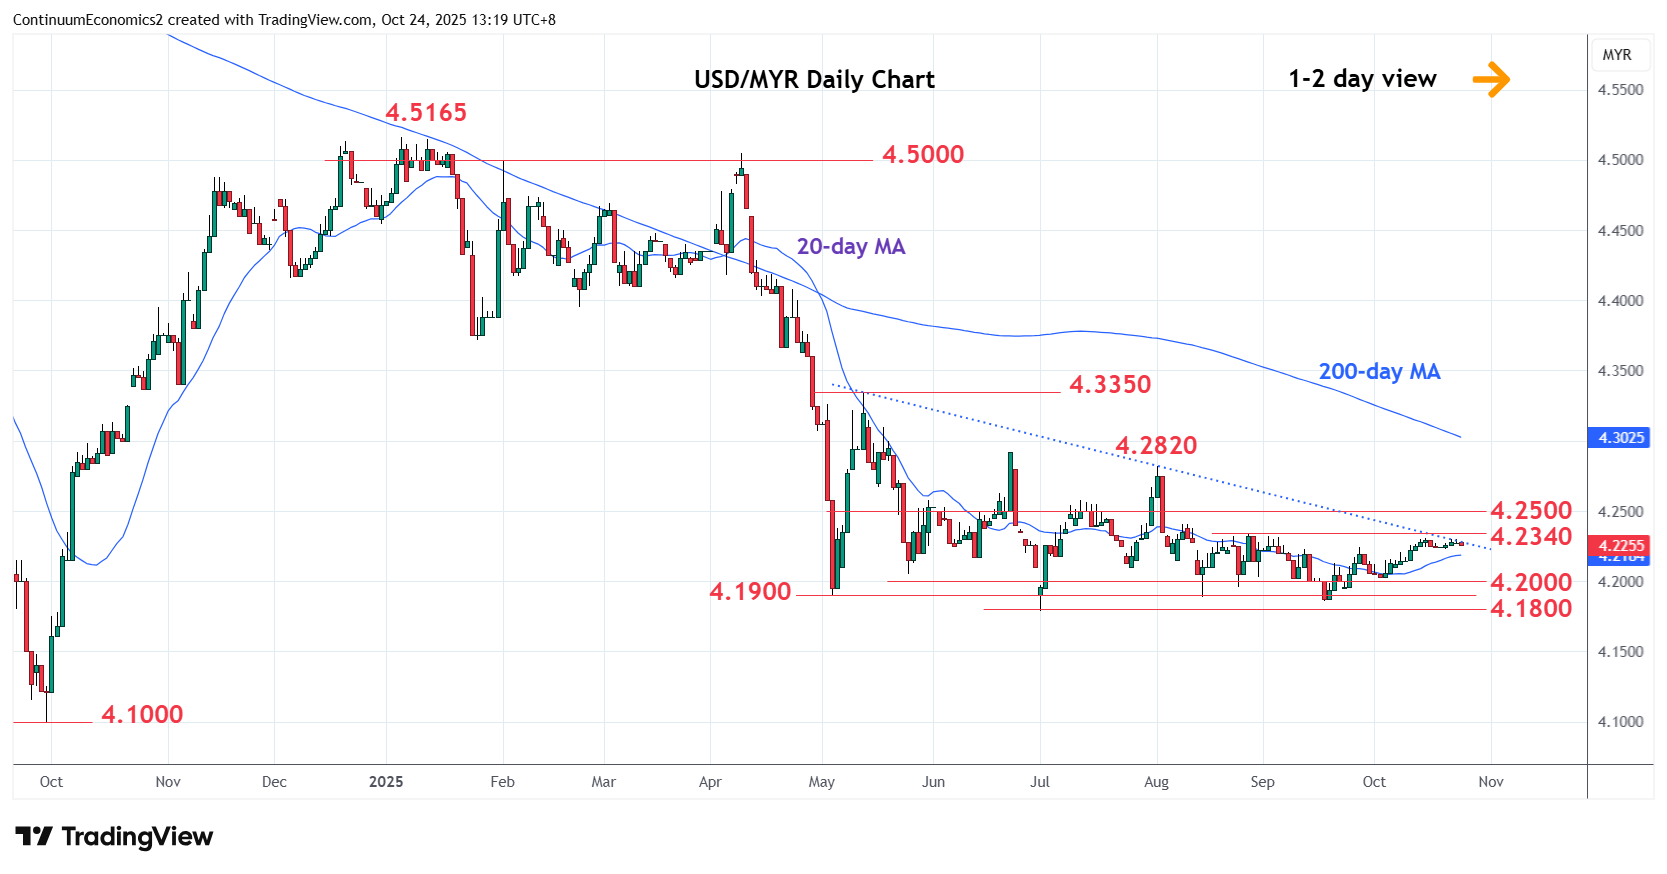
Holds a narrow range within the 4.2300/4.2200 area as prices consolidate gains from the 4.1860, September low
| Levels | Imp | Comment | Levels | Imp | Comment | |||
|---|---|---|---|---|---|---|---|---|
| R4 | 4.2600 | * | congestion | S1 | 4.2150 | 3 Oct high | ||
| R3 | 4.2500 | * | congestion | S2 | 4.2000 | * | congestion | |
| R2 | 4.2400 | * | 8 Aug high | S3 | 4.1900 | * | May low | |
| R1 | 4.2300/40 | ** | congestion, 27 Aug high | S4 | 4.1800 | ** | 1 Jul YTD low |
Asterisk denotes strength of level
05:25 GMT - Holds a narrow range within the 4.2300/4.2200 area as prices consolidate gains from the 4.1860, September low. Consolidation here expected to give way to stronger gains to retrace the August/September losses to resistance at 4.2400 level. Higher still will see room to the 4.2500/4.2600 congestion area. However, gains are seen corrective and expected to give way to selling pressure later. Meanwhile, support is raised to the 4.2150/4.2000 area. Break here will return focus to the downside for retest of the 4.1900/4.1800 lows and see room for deeper pullback to retrace the 2024/2025 rally.