Published: 2026-01-23T06:26:29.000Z
Chart USD/IDR Updates: Extending pullback from 16975 record high
5
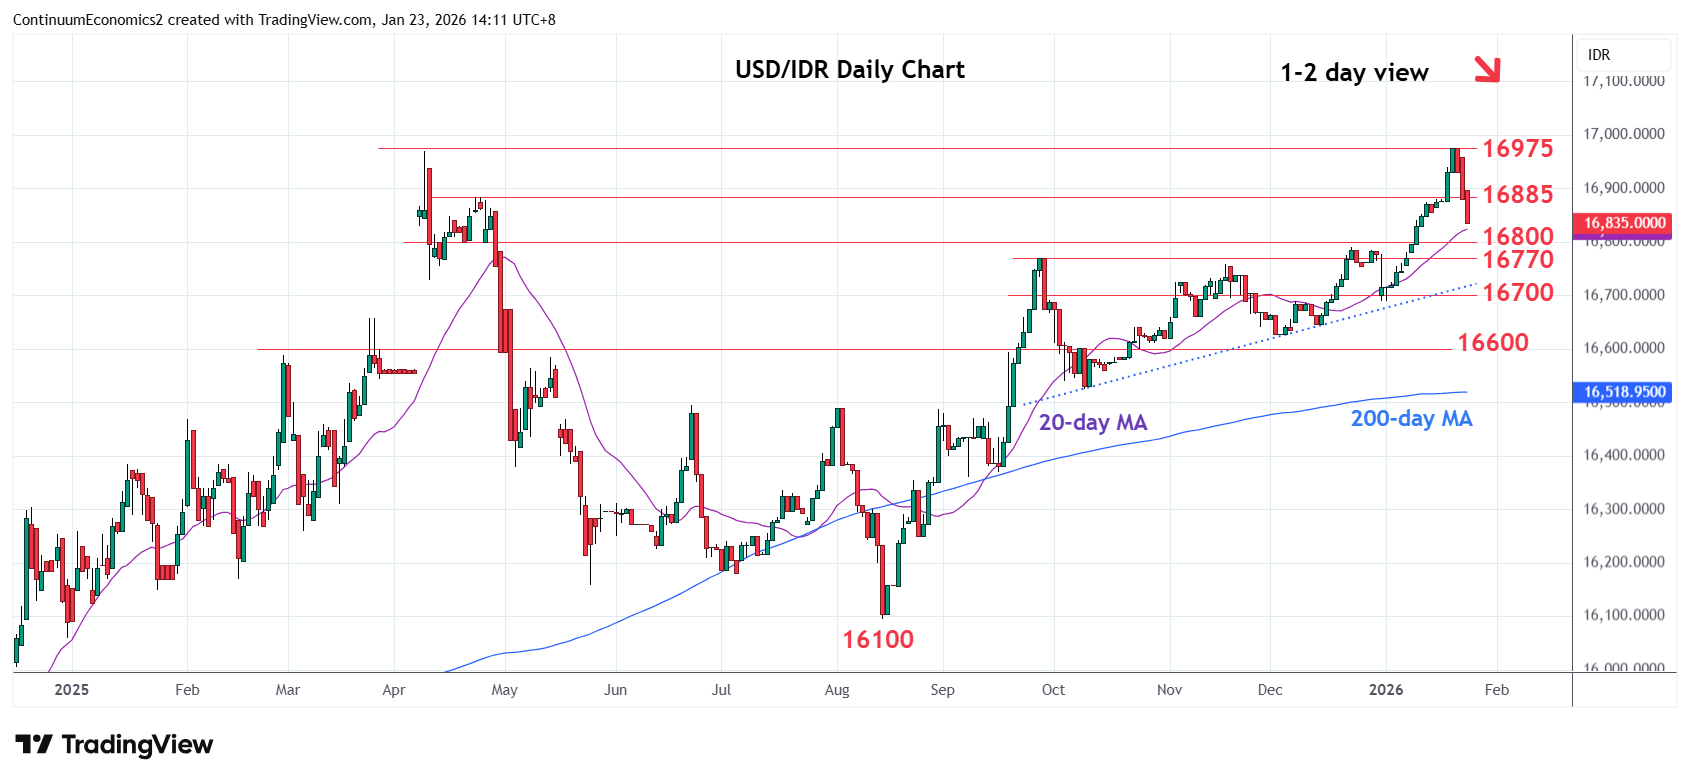
Break of the 16900/16885 area see prices extending pullback from the 16975 record high
| Levels | Imp | Comment | Levels | Imp | Comment | |||
|---|---|---|---|---|---|---|---|---|
| R4 | 17270 | * | projection | S1 | 16800 | * | congestion | |
| R3 | 17050 | * | projection | S2 | 16770 | * | Sep high | |
| R2 | 16975 | ** | 20 Jan all-time high | S3 | 16690 | ** | 31 Dec low | |
| R1 | 16885 | * | 23 Apr high | S4 | 16640 | * | 38.2% Aug/Jan rally |
Asterisk denotes strength of level
06:20 GMT - Break of the 16900/16885 area see prices extending pullback from the 16975 record high to unwind overbought daily and weekly studies. Lower will see room to strong support at the 16800/16770 congestion area and September high which is expected to underpin. Break here will open up room for deeper pullback to retrace strong gains from the April low to 16700/16690 support and 16640 38.2% Fibonacci level. Meanwhile, resistance is lowered to 16885/16900 area which is expected to cap and sustain losses from the 16975 high.