Published: 2026-03-26T04:08:47.000Z
Chart USD/CNH Update: Pressuring 6.9100 range high
1
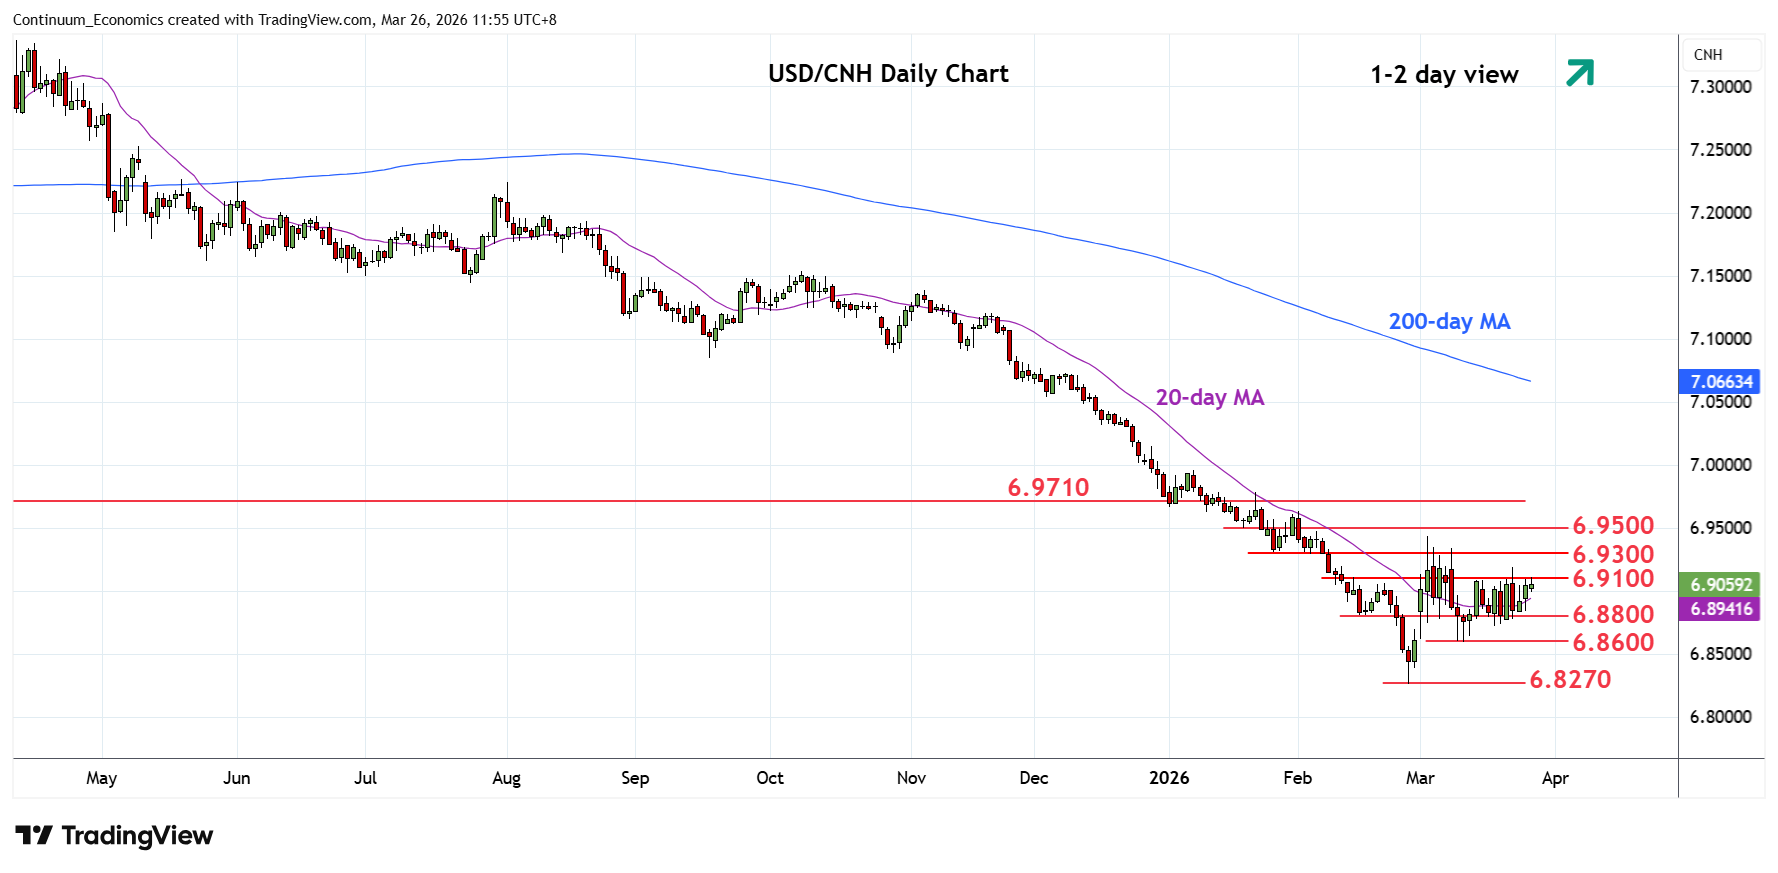
Choppy trade see prices pressuring resistance at the 6.9100 congestion
| Level | Imp | Comment | Level | Imp | Comment | |||
|---|---|---|---|---|---|---|---|---|
| R4 | 6.9710 | * | 2024 year low | S1 | 6.8800 | * | 16 Feb low, congestion | |
| R3 | 6.9500 | * | congestion, 38.2% | S2 | 6.8600 | ** | 11 Mar low | |
| R2 | 6.9300 | ** | Jan low, congestion | S3 | 6.8270 | ** | 26 Feb YTD low | |
| R1 | 6.9100 | * | congestion | S4 | 6.8000 | * | congestion |
Asterisk denotes strength of level
04:00 GMT - Choppy trade see prices pressuring resistance at the 6.9100 congestion. Break here will clear the way for retest of strong resistance at the 6.9300/6.9500 congestion and 38.2% Fibonacci retracement. Above this will open up room for stronger gains to retrace losses from the October high to resistance at 6.9710 and 6.9910, 50% Fibonacci level. Meanwhile, support at the 6.8800 congestion should underpin. Failure here will return focus to the downside for retest of the 6.8600 support and the 6.8270 February current year low.