Chart USD/SGD Update: Under pressure
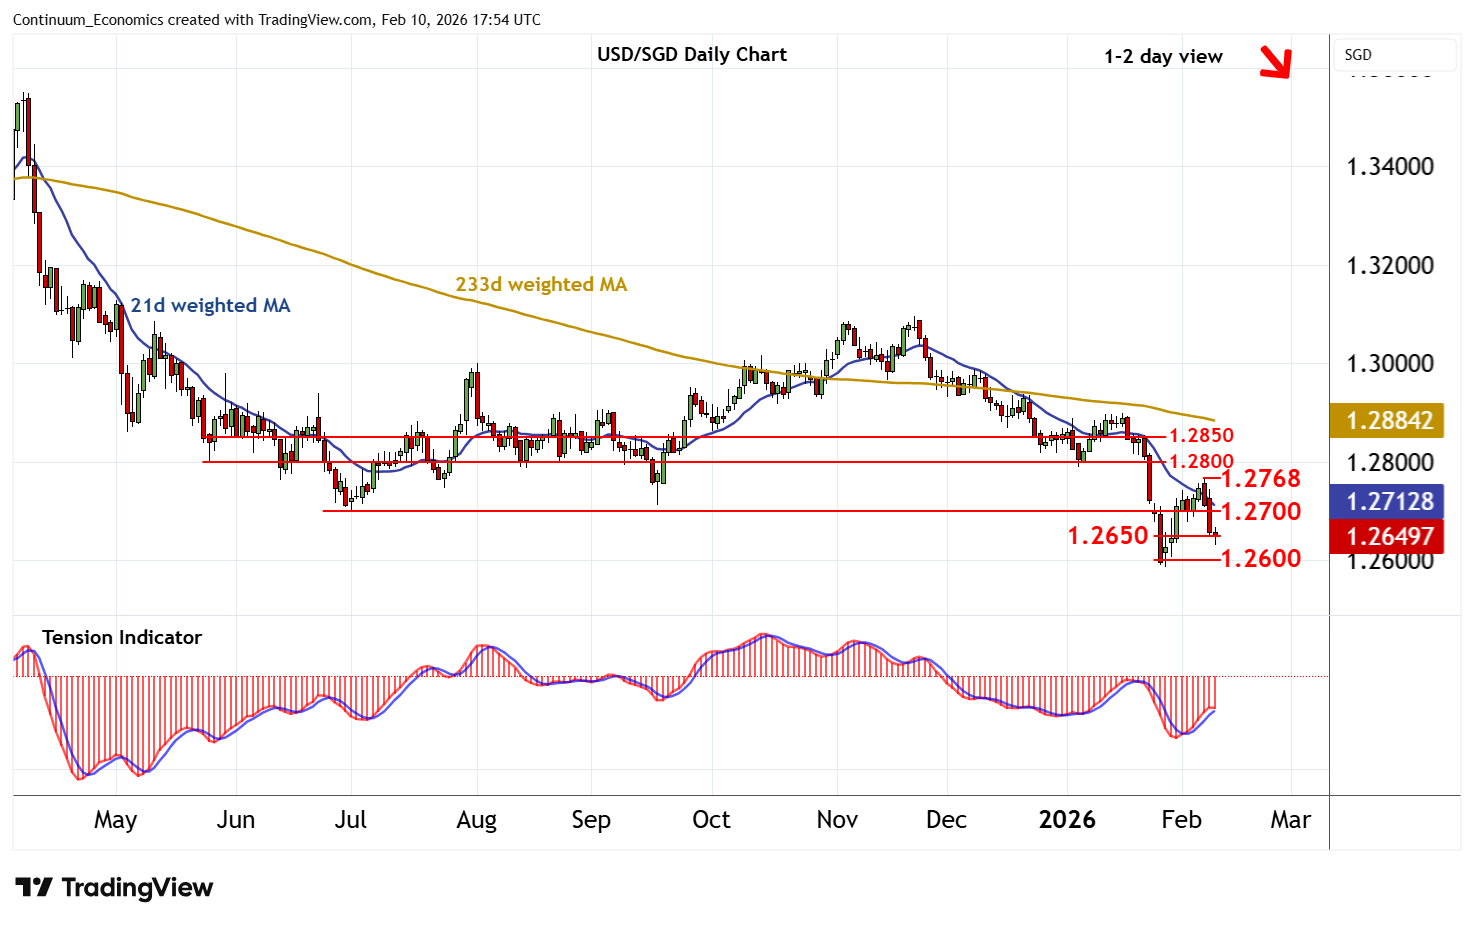
Corrective gains have been pushed back from 1.2768
| Level | Comment | Level | Comment | ||||
|---|---|---|---|---|---|---|---|
| R4 | 1.2850 | * | congestion | S1 | 1.2650 | * | congestion |
| R3 | 1.2800 | * | congestion | S2 | 1.2600 | * | congestion |
| R2 | 1.2768 | ** | 6 Feb (w) high | S3 | 1.2586 | ** | 28 Jan YTD low |
| R1 | 1.2700 | ** | break level | S4 | 1.2550 | * | congestion |
Asterisk denotes strength of level
17:45 GMT - Corrective gains have been pushed back from 1.2768, as overbought daily stochastics unwind and the rising daily Tension Indicator flattens, with steady selling interest currently pressuring congestion support at 1.2650. A break will open up critical support at the 1.2586 current year low of 28 January and congestion around 1.2600. However, broader weekly charts are also under pressure, pointing to room for a later break beneath here and extension of March 2020 losses towards historic (2014) congestion around 1.2550. Meanwhile, a close above resistance at 1.2700 would help to stabilise price action and give way to consolidation beneath the 1.2768 weekly high of 6 February.