Published: 2026-04-22T05:13:09.000Z
Chart USD/INR Update: Extending gains from 92.4050 low
-
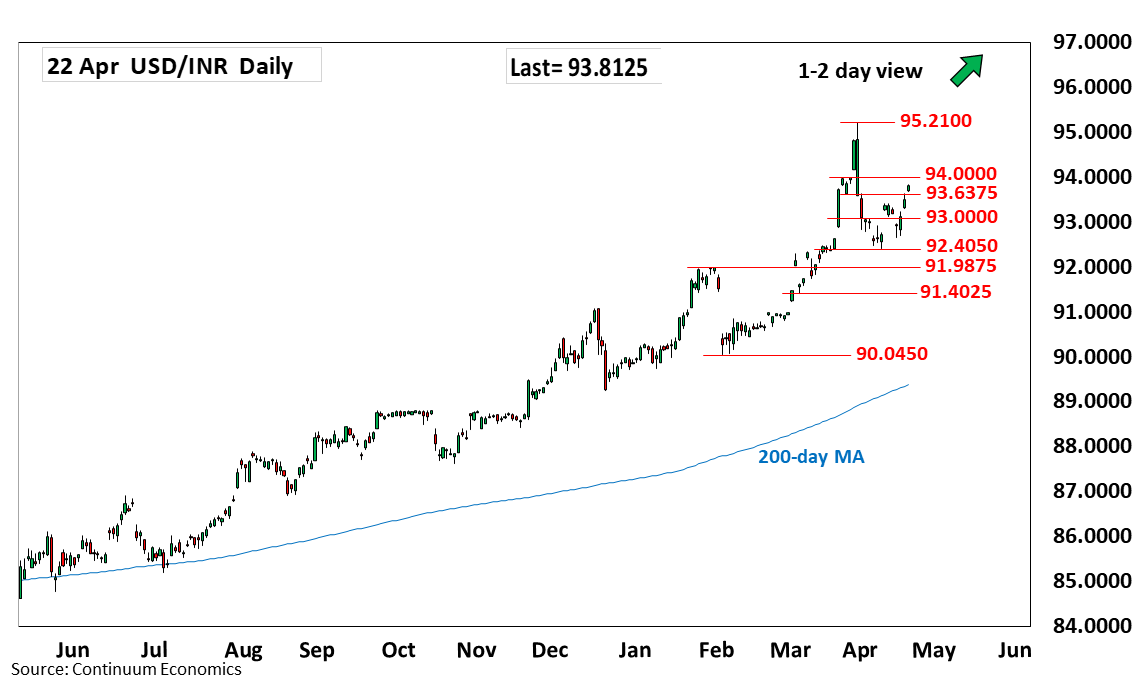
Extending bounce from the 92.6500 low of last week as prices retrace pullback from the 95.2100, 30 March historic high
| Level | Comment | Level | Comment | |||||
|---|---|---|---|---|---|---|---|---|
| R4 | 95.5000 | * | figure | S1 | 93.4100 | * | 15 Apr high | |
| R3 | 95.2100 | ** | 30 Mar all-time high | S2 | 93.0000 | * | congestion | |
| R2 | 94.8400 | * | 27 Mar high | S3 | 92.6500 | * | 17 Apr low | |
| R1 | 94.0000 | ** | figure | S4 | 92.4050 | ** | 10 Apr low |
Asterisk denotes strength of level
05:10 GMT - Extending bounce from the 92.6500 low of last week as prices retrace losses from the 95.2100, 30 March historic high. Break above 93.6375 resistance see room for retest of strong resistance at the 94.0000 level where reaction is expected. Gains above here, if seen, will see scope for retest of the 95.2100 all-time high. Meanwhile, support is raised to the 93.4100 high of 15 April and extending to the 93.0000 congestion. Would take break here to expose the 92.6500 and 92.4050 lows to retest and see room for deeper pullback to retrace gains from the 90.0450 February low.