Published: 2026-01-15T05:21:45.000Z
Chart USD/INR Update: Higher to retrace December losses
-
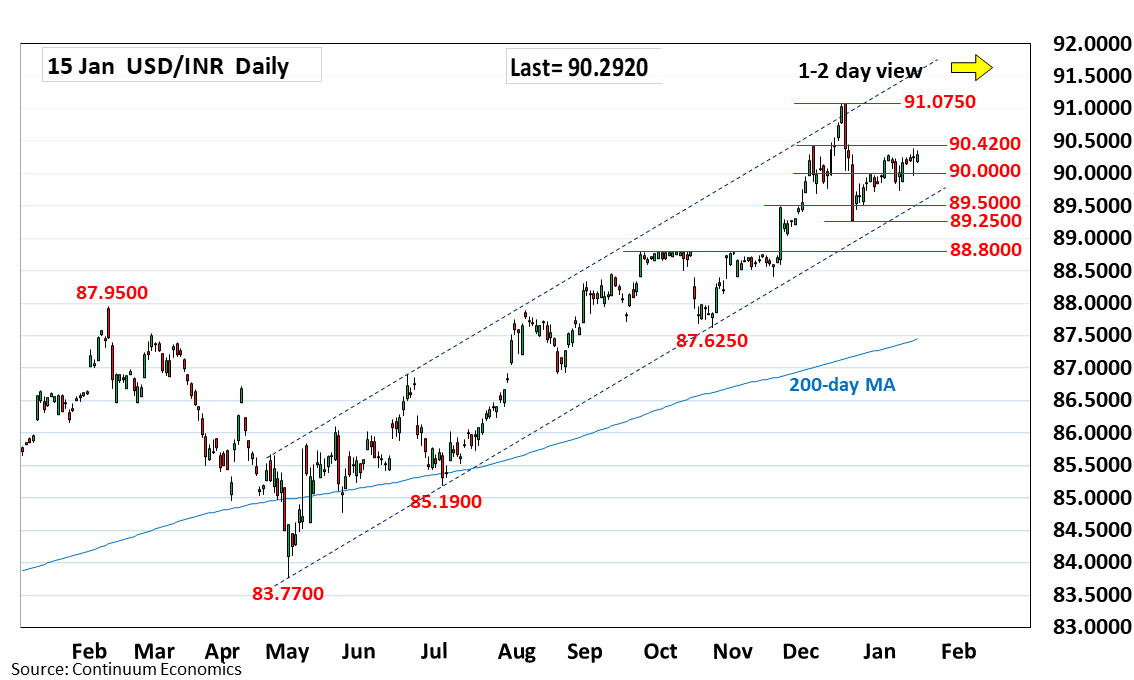
Extending gains from the 89.2500 December low to reach 90.3830 high as prices retrace losses from the 91.0750 record high
| Level | Comment | Level | Comment | |||||
|---|---|---|---|---|---|---|---|---|
| R4 | 91.0750 | ** | Dec 2025 all-time high | S1 | 90.0000 | * | figure | |
| R3 | 90.5000 | * | congestion | S2 | 89.7200 | ** | 30 Dec low | |
| R2 | 90.4200 | * | 4 Dec high | S3 | 89.5000 | * | congestion | |
| R1 | 90.3830 | ** | 14 Jan high | S4 | 89.2500 | ** | Dec low |
Asterisk denotes strength of level
05:20 GMT - Extending gains from the 89.2500 December low to reach 90.3830 high as prices retrace losses from the 91.0750 record high. Gains are seen corrective and nearby see strong resistance at the 90.4200/90.5000, early-December high and congestion area. Overbought daily studies suggest this giving way to renewed selling pressure later. Break of the 90.0000 figure and 89.7200 support will return focus to the downside for retest of the 89.5000 congestion then 89.2500 December low. Below the latter will see room for deeper pullback to retrace to May/December rally.