Published: 2025-11-13T05:28:10.000Z
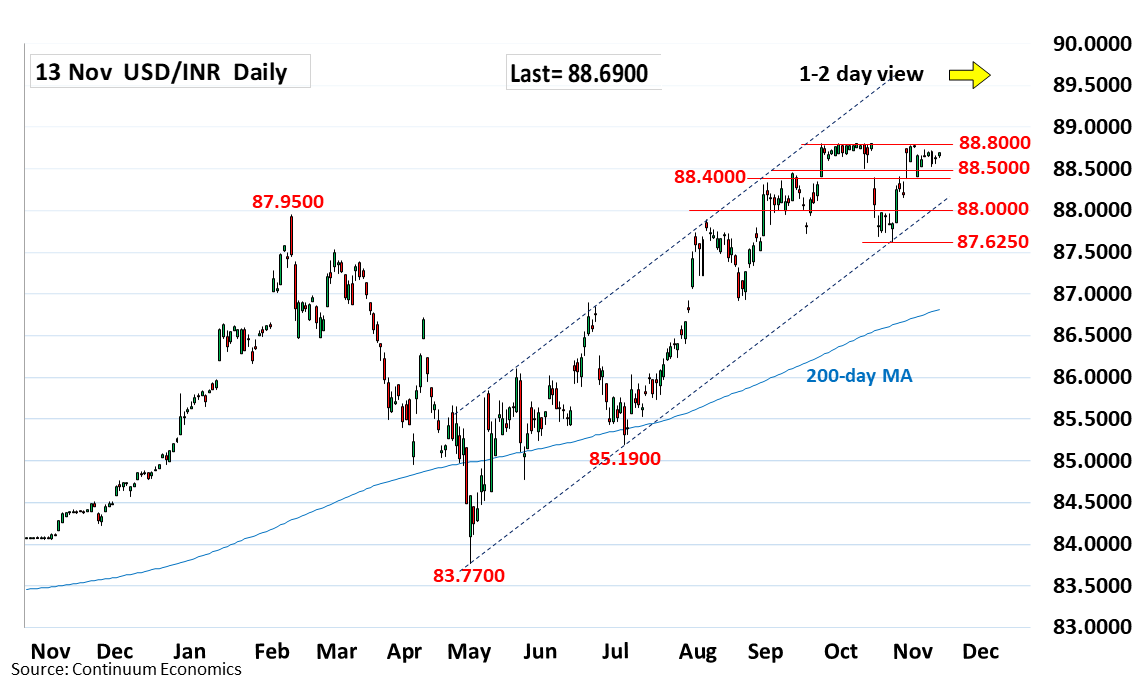
Chart USD/INR Update: Supported above 88.5000/88.4000 area
2
Little change, as prices extend ranging action below the 88.7950 and 88.8000 highs
| Level | Comment | Level | Comment | |||||
|---|---|---|---|---|---|---|---|---|
| R4 | 89.5000 | * | projection | S1 | 88.4000 | * | 28 Oct high | |
| R3 | 89.2000 | * | projection | S2 | 88.0000 | * | congestion | |
| R2 | 89.0000 | * | figure | S3 | 87.6250 | ** | Oct low | |
| R1 | 88.8000 | ** | 30 Sep all-time high | S4 | 87.5000 | * | congestion |
Asterisk denotes strength of level
05:20 GMT - Little change, as prices extend ranging action below the 88.7950 and 88.8000 highs. While support at the 88.5000/88.4000 area underpin, consolidation is expected to give way to renewed strength later to extend the underlying bull trend and see room for extension to the 89.0000 figure. Would take break of the 88.5000/88.4000 support to fade the upside pressure and turn focus to the downside towards the 88.0000 level. Break here will threaten pullback to retest the 87.6250, October swing low.