Published: 2026-04-06T06:45:39.000Z
Chart USD/PHP Updates: Lower in consolidation from 60.810 historic high
-
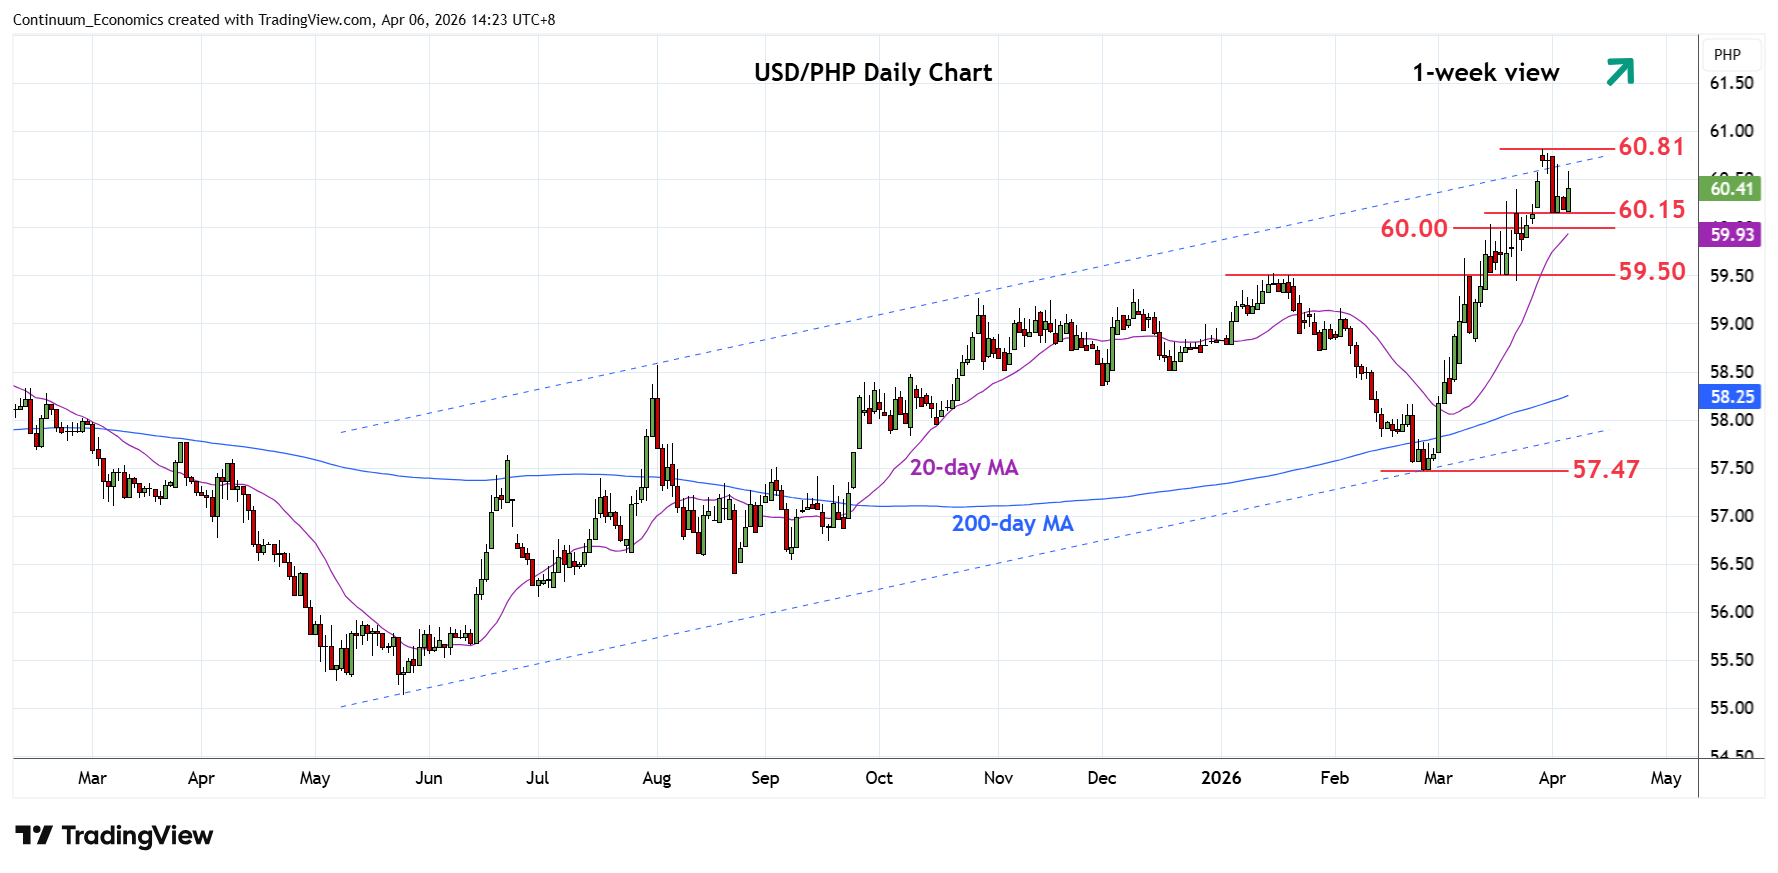
Settled back from the 60.81 all-time high as prices consolidate rally from the 57.470 February low to reach 60.15 low
| Level | Comment | Level | Comment | |||||
|---|---|---|---|---|---|---|---|---|
| R4 | 61.850 | projection | S1 | 60.150 | * | 1 Apr low | ||
| R3 | 61.000 | * | figure | S2 | 60.000 | * | figure | |
| R2 | 60.900 | projection | S3 | 59.500 | ** | Jan high, congestion | ||
| R1 | 60.810 | ** | 30 Mar all-time high | S4 | 59.200/150 | * | congestion, 50% Feb/Mar rally |
Asterisk denotes strength of level
06:40 GMT - Settled back from the 60.81 all-time high as prices consolidate rally from the 57.470 February low to reach 60.15 low. Overbought daily studies caution deeper correction to the 60.000 figure then the strong support at 59.500, January high. Would expect the latter underpin but a later break cannot be ruled out to open up room for deeper pullback to 59.200/59.150 congestion and 50% Fibonacci retracement. Meanwhile, break above the 60.810 high, if seen, will see room for extension to the 60.900 projection target then the 61.000 figure.