Published: 2025-10-24T05:43:06.000Z
Chart USD/IDR Updates: Extend corrective bounce from 16525 low
2
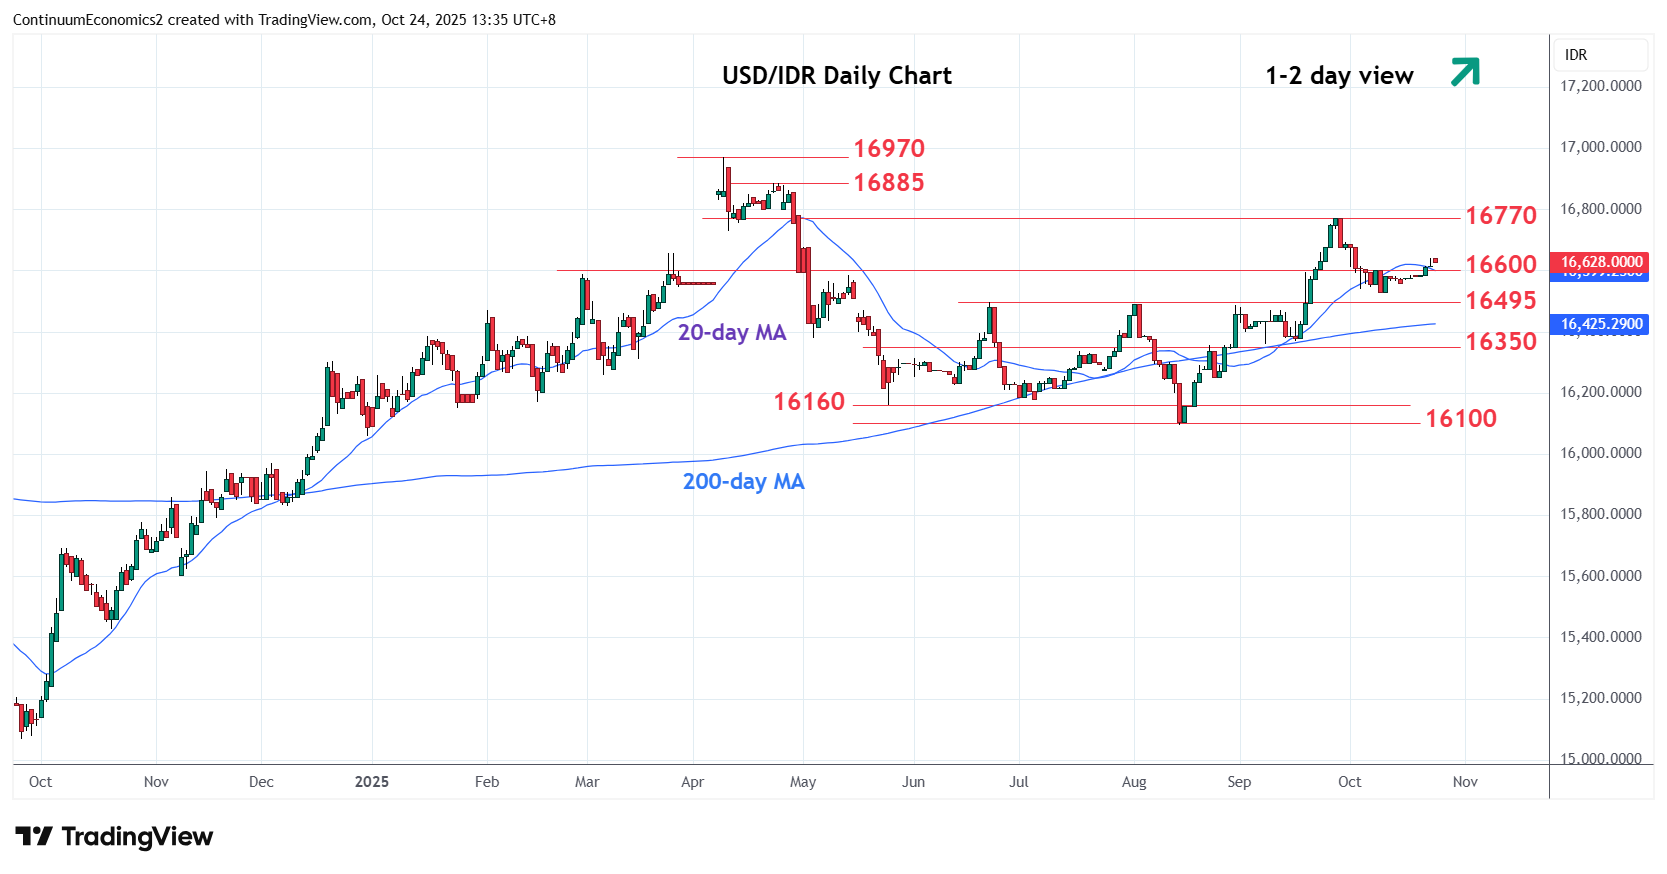
Break above 16600 see prices extending bounce from the 16525 low of last week
| Levels | Imp | Comment | Levels | Imp | Comment | |||
|---|---|---|---|---|---|---|---|---|
| R4 | 16885 | * | 23 Apr high | S1 | 16600 | * | congestion | |
| R3 | 16800 | * | congestion | S2 | 16525 | * | 9 Oct low | |
| R2 | 16770 | ** | 26 Sep high | S3 | 16495 | ** | Jun high | |
| R1 | 16700 | * | figure | S4 | 16350 | * | congestion |
Asterisk denotes strength of level
05:40 GMT - Break above 16600 see prices extending bounce from the 16525 low of last week. Daily studies are unwinding oversold readings and suggest scope for stronger gains to the 16700 level. Clearance here will expose the 16770 high to retest. However, this is expected to cap and give way to renewed selling pressure later. Meanwhile, support is raised to the 16600 congestion ahead of the 16525 low. A later break here will open up room for extension to strong support at the 16495, June-August range highs.