Published: 2026-04-08T05:06:33.000Z
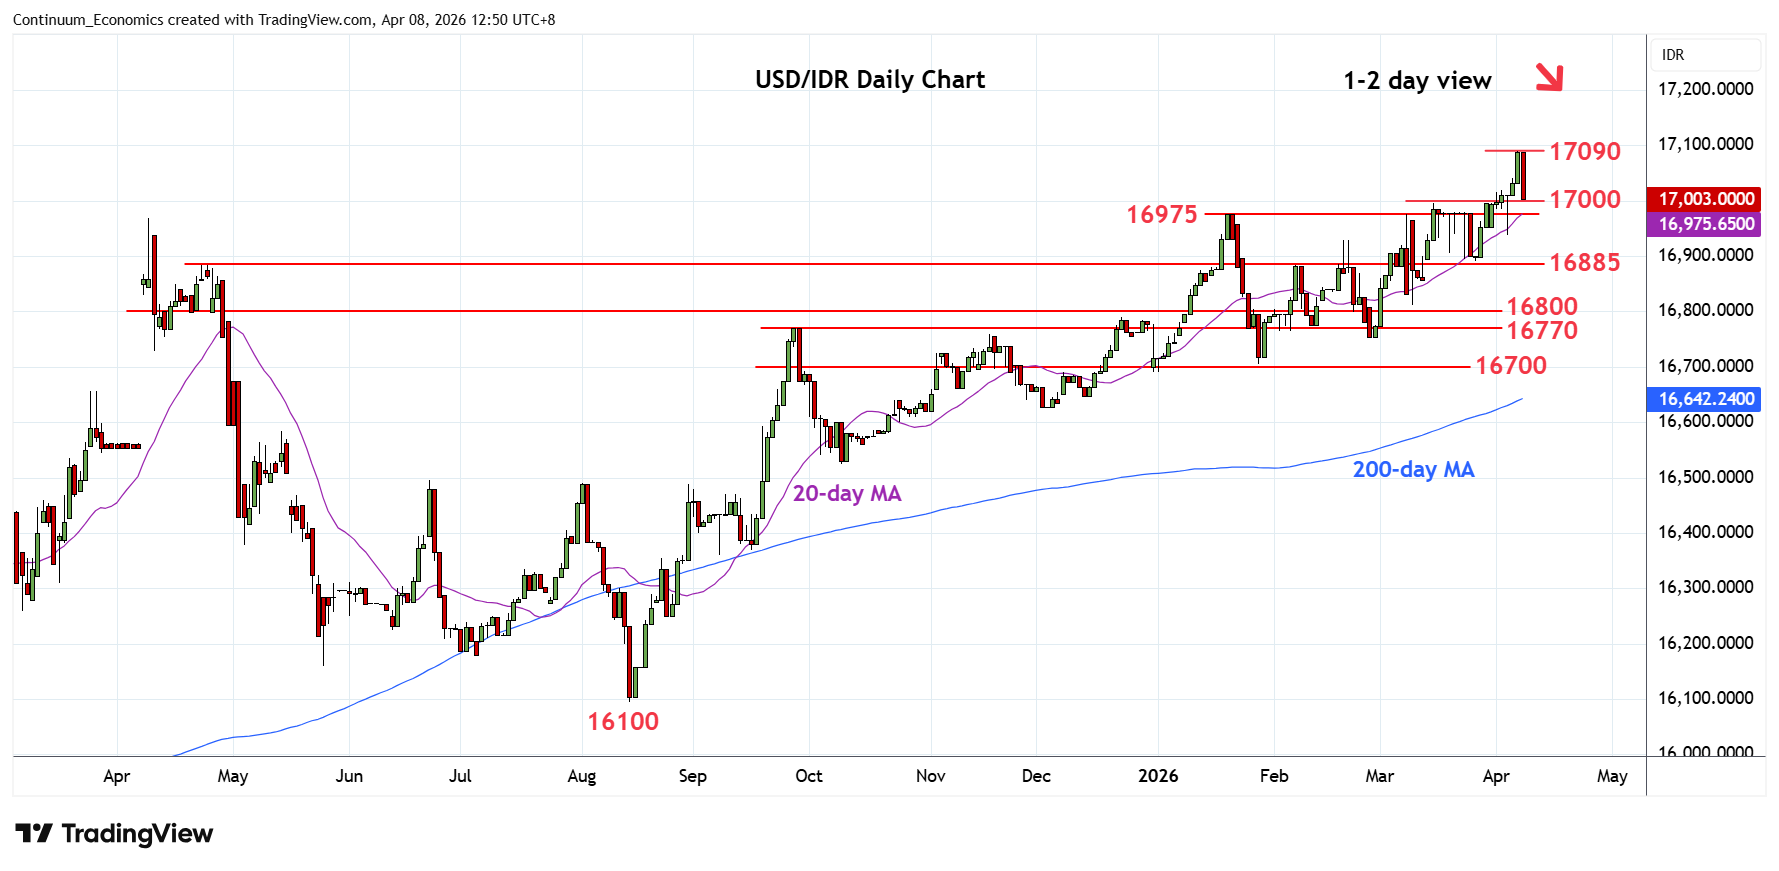
Chart USD/IDR Updates: Turned down from 17090 historic high
5
Weak start see prices turning sharply lower from the 17090 all-time high to pressure strong support at the 16995/16975
| Levels | Imp | Comment | Levels | Imp | Comment | |||
|---|---|---|---|---|---|---|---|---|
| R4 | 18000 | figure | S1 | 16995/75 | ** | Mar/Jan highs | ||
| R3 | 17600 | projection | S2 | 16885 | ** | congestion | ||
| R2 | 17200 | projection | S3 | 16800 | * | congestion | ||
| R1 | 17090 | ** | 7 Apr all-time high | S4 | 16755 | ** | Feb low |
Asterisk denotes strength of level
05:00 GMT - Weak start see prices turning sharply lower from the 17090 all-time high to pressure strong support at the 16995/16975, March/January highs. Weekly chart are stretched as well and highlight risk for break here to open up room for deeper pullback to retrace gains from the late-January low. Lower will see room to support at the 16900/16885 congestion area. Lower still, will see scope to the 16800 level. Meanwhile, resistance at the 17090 high is expected to cap. Clearance, if seen, will see room for extension to the 17200 and 17600 projection targets.