Published: 2025-11-19T02:45:04.000Z
Chart USD/THB Update: Extend consolidation within 32.30/32.50 area
1
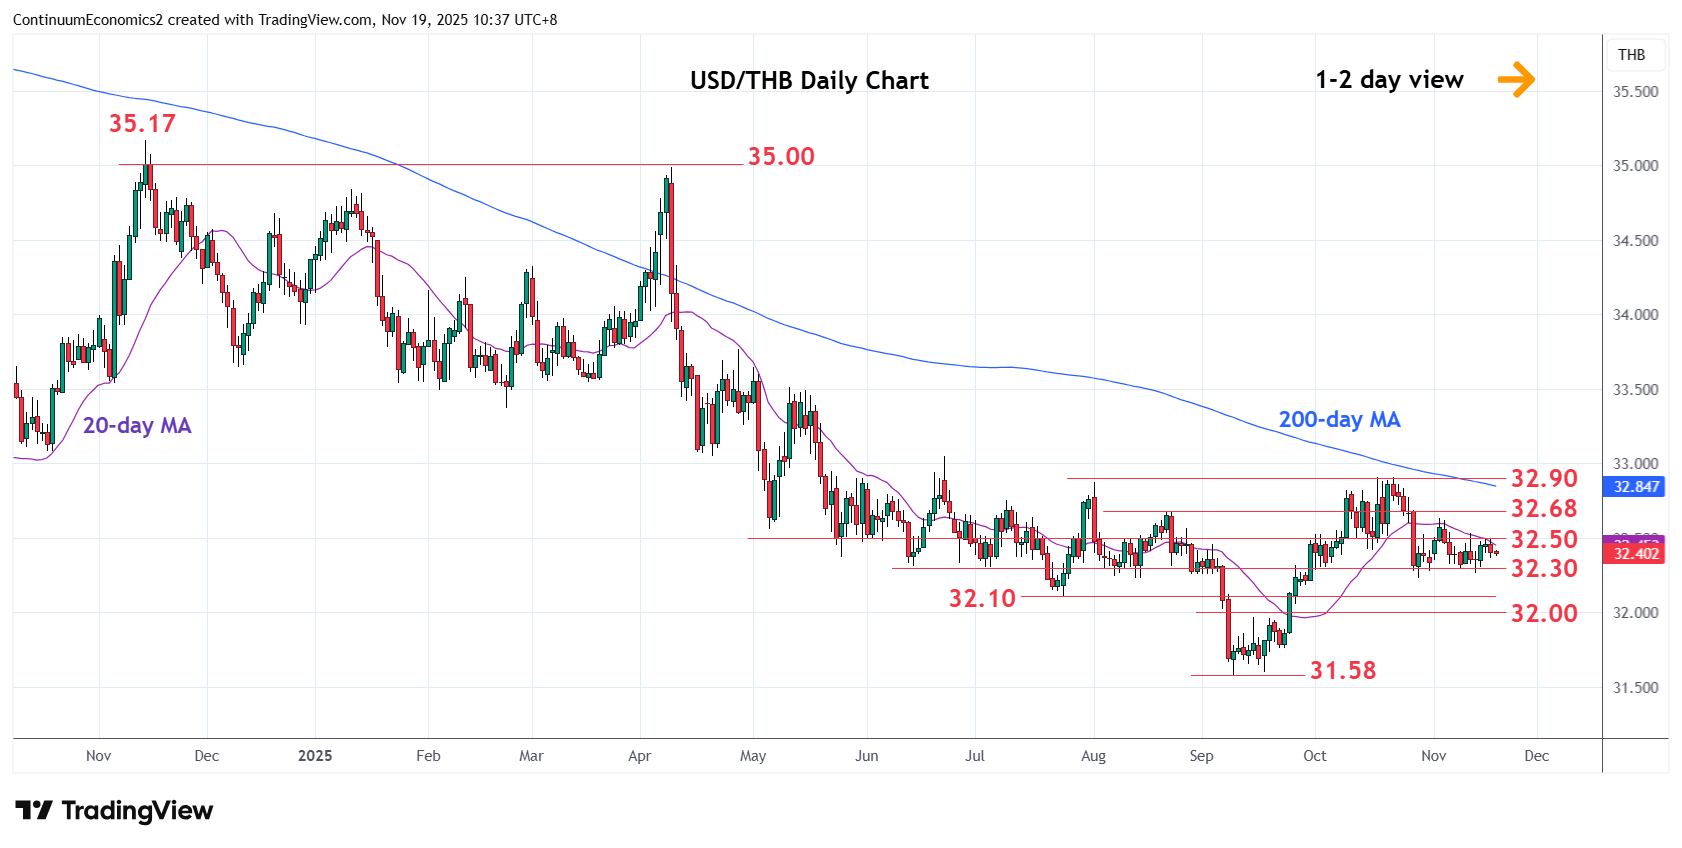
Little change, as prices extend consolidation within the 32.30/32.50 range area
| Level | Comment | Level | Comment | |||||
|---|---|---|---|---|---|---|---|---|
| R4 | 32.95 | * | 38.2% Nov 2024/Sep fall | S1 | 32.30 | ** | Jun low, congestion | |
| R3 | 32.88/90 | ** | 1 Aug high, congestion | S2 | 32.23 | * | Oct low | |
| R2 | 32.68 | * | 22 Aug high | S3 | 32.10 | ** | Jul low | |
| R1 | 32.50 | * | congestion | S4 | 32.00 | * | figure |
Asterisk denotes strength of level
02:40 GMT - Little change, as prices extend consolidation within the 32.30/32.50 range area. Would take break above 32.50 to open up room for stronger gains to resistance at the 32.63/32.68 area which is expected to cap and give way to renewed selling pressure later. Meanwhile, support at the 32.30/32.23 lows now underpin. Break here will extend the pullback from the 32.90 October high and see room for extension to strong support at the 32.10 July low and the 32.00 figure. Below this will return focus to the 31.60/31.58, September current year low.