Published: 2025-10-30T05:11:30.000Z
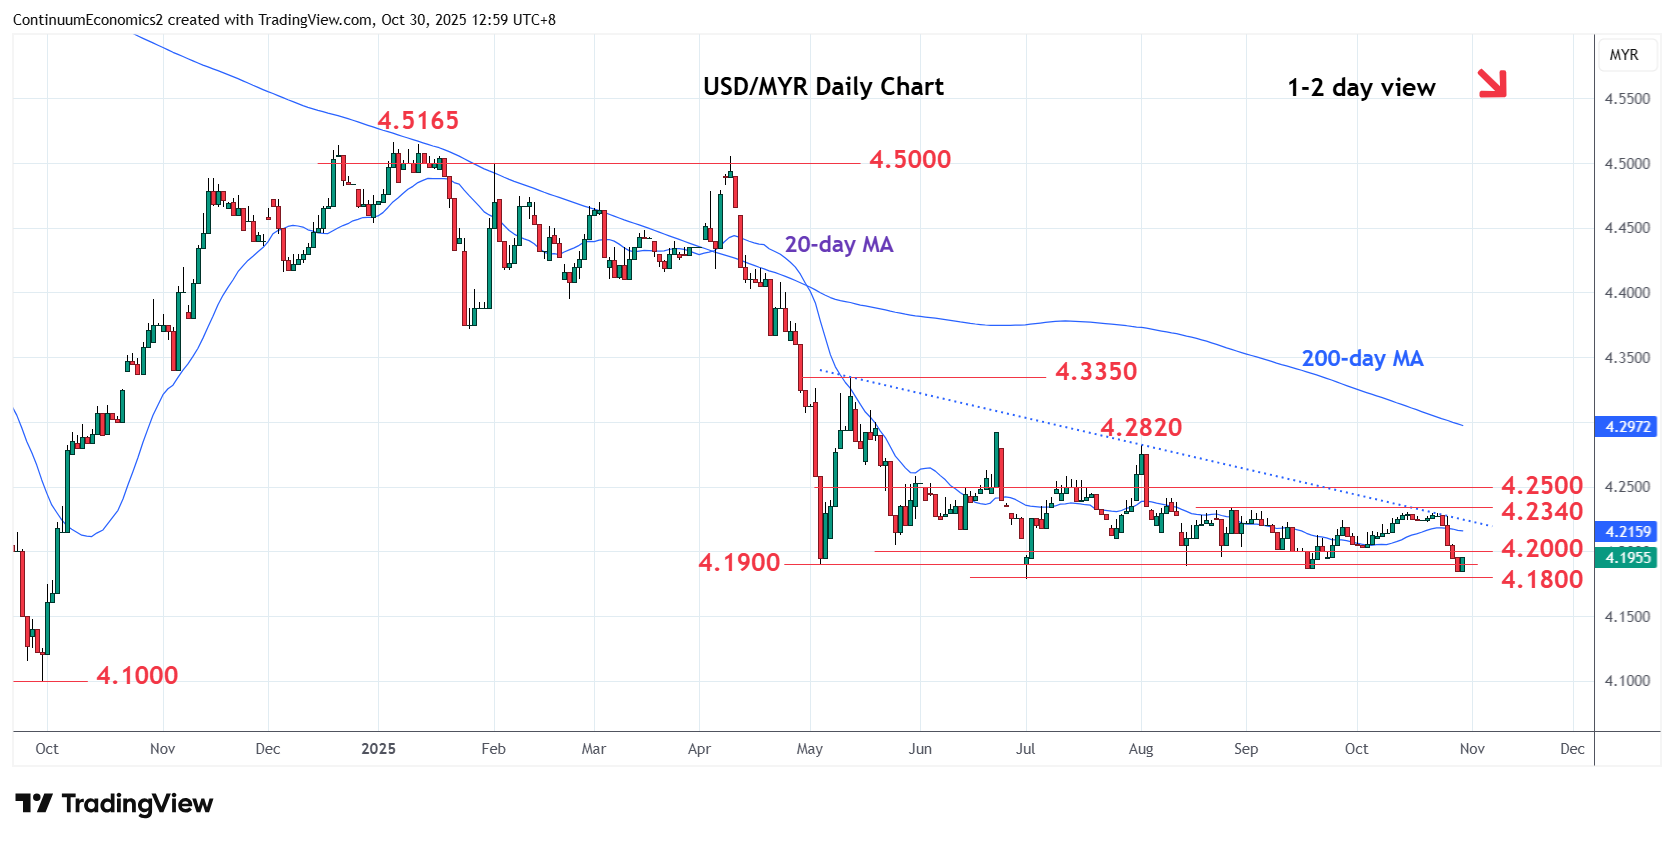
Chart USD/MYR Update: Consolidating test of 4.1900/4.1800 lows
1
Break of the 4.2000 level has seen extension to reach the 4.1900 and 4.1800, May and 1 July current year lows

| Levels | Imp | Comment | Levels | Imp | Comment | |||
|---|---|---|---|---|---|---|---|---|
| R4 | 4.2500 | * | congestion | S1 | 4.1900 | * | May low | |
| R3 | 4.2400 | * | 8 Aug high | S2 | 4.1800 | ** | 1 Jul YTD low | |
| R2 | 4.2300/40 | ** | congestion, 27 Aug high | S3 | 4.1500 | * | congestion | |
| R1 | 4.2230 | * | 21 Oct low | S4 | 4.1150 | * | 25 Sep 2024 low |
Asterisk denotes strength of level
05:10 GMT - Break of the 4.2000 level has seen extension to reach the 4.1900 and 4.1800, May and 1 July current year lows. Bounce here see prices unwinding oversold intraday studies and consolidating losses from the 4.2300 high and May trendline. Consolidation is expected to give way to break later to extend the broader losses from the 4.5165 January current year high. Lower will see room to the 4.1500 congestion but focus will return to the 4.1000, September 2024 year low. Meanwhile, resistance is lowered to 4.2200/4.2230 area which is expected to cap.