Published: 2026-01-09T05:24:23.000Z
Chart USD/IDR Updates: Extending gains, focus return to April highs
1
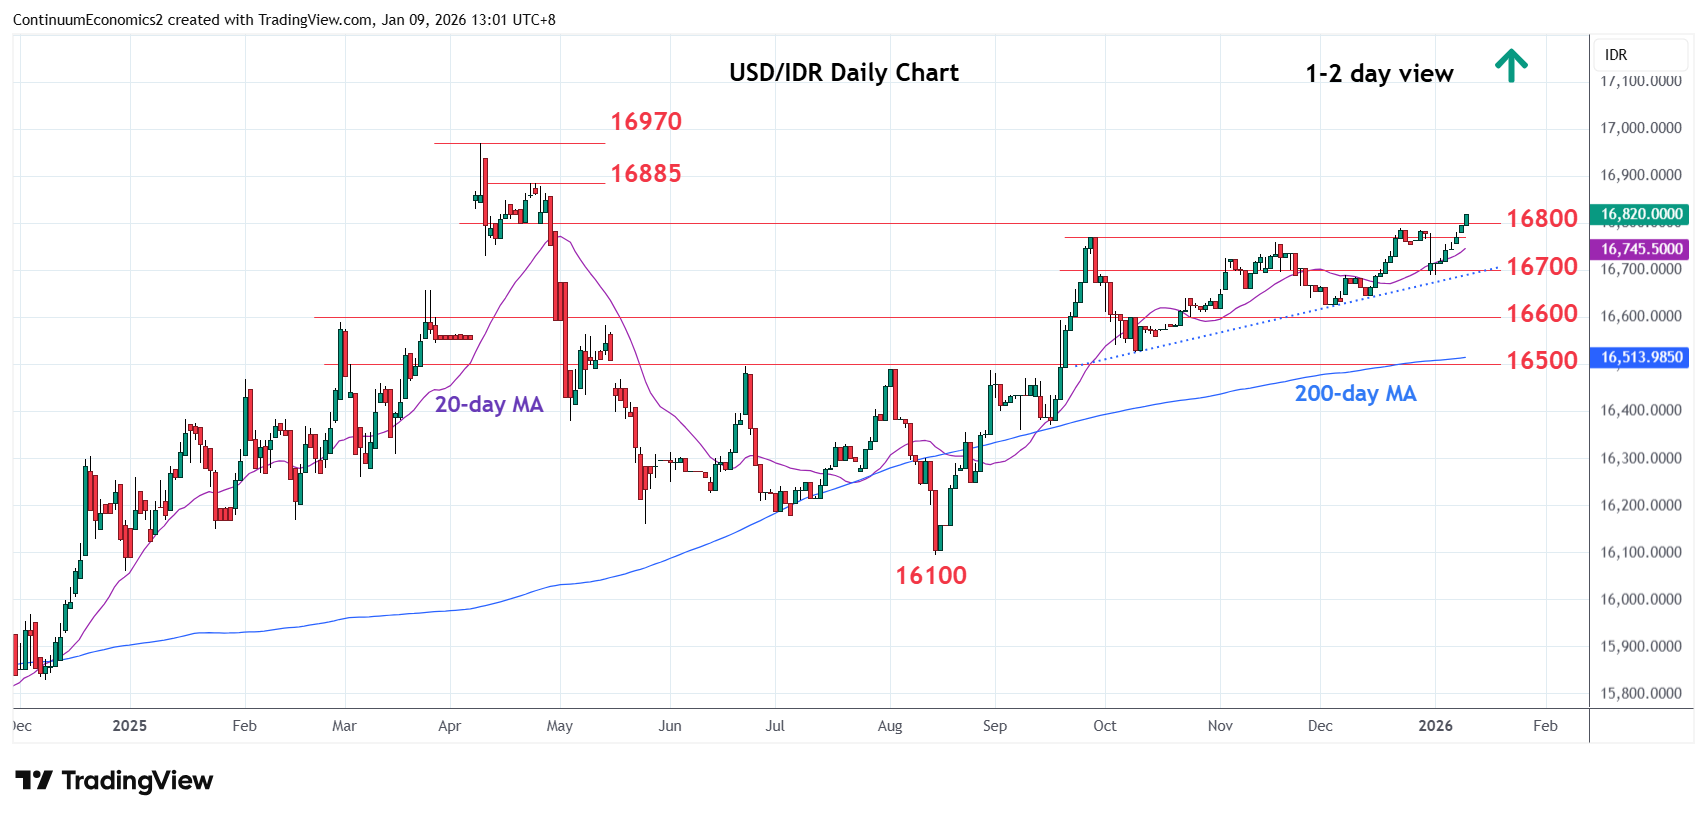
Break of the 16790 December high and the 16800 level see prices extending gains from the 16100, August low
| Levels | Imp | Comment | Levels | Imp | Comment | |||
|---|---|---|---|---|---|---|---|---|
| R4 | 17270 | * | extension | S1 | 16690 | * | 8 Dec high | |
| R3 | 17050 | * | extension | S2 | 16625 | ** | 2 Dec low | |
| R2 | 16970 | ** | 9 Apr 2025 all-time high | S3 | 16600 | * | congestion | |
| R1 | 16885 | * | 23 Apr high | S4 | 16525 | * | Oct low |
Asterisk denotes strength of level
05:20 GMT - Break of the 16790 December high and the 16800 level see prices extending gains from the 16100, August low. Break open up room for retest of resistance at 16885 then the 16970, April 2025 all-time high. Would expect reaction at the latter but a later break cannot be rul out to extend the underlying bull trend. Meanwhile, support remains at the 16700/16690 congestion area which should underpin. Would take break here to fade the upside pressure and open up room for deeper corrective pullback of the August rally.