Published: 2026-01-13T05:07:54.000Z
Chart USD/MYR Update: Extend consolidation above 4.0330 low
-
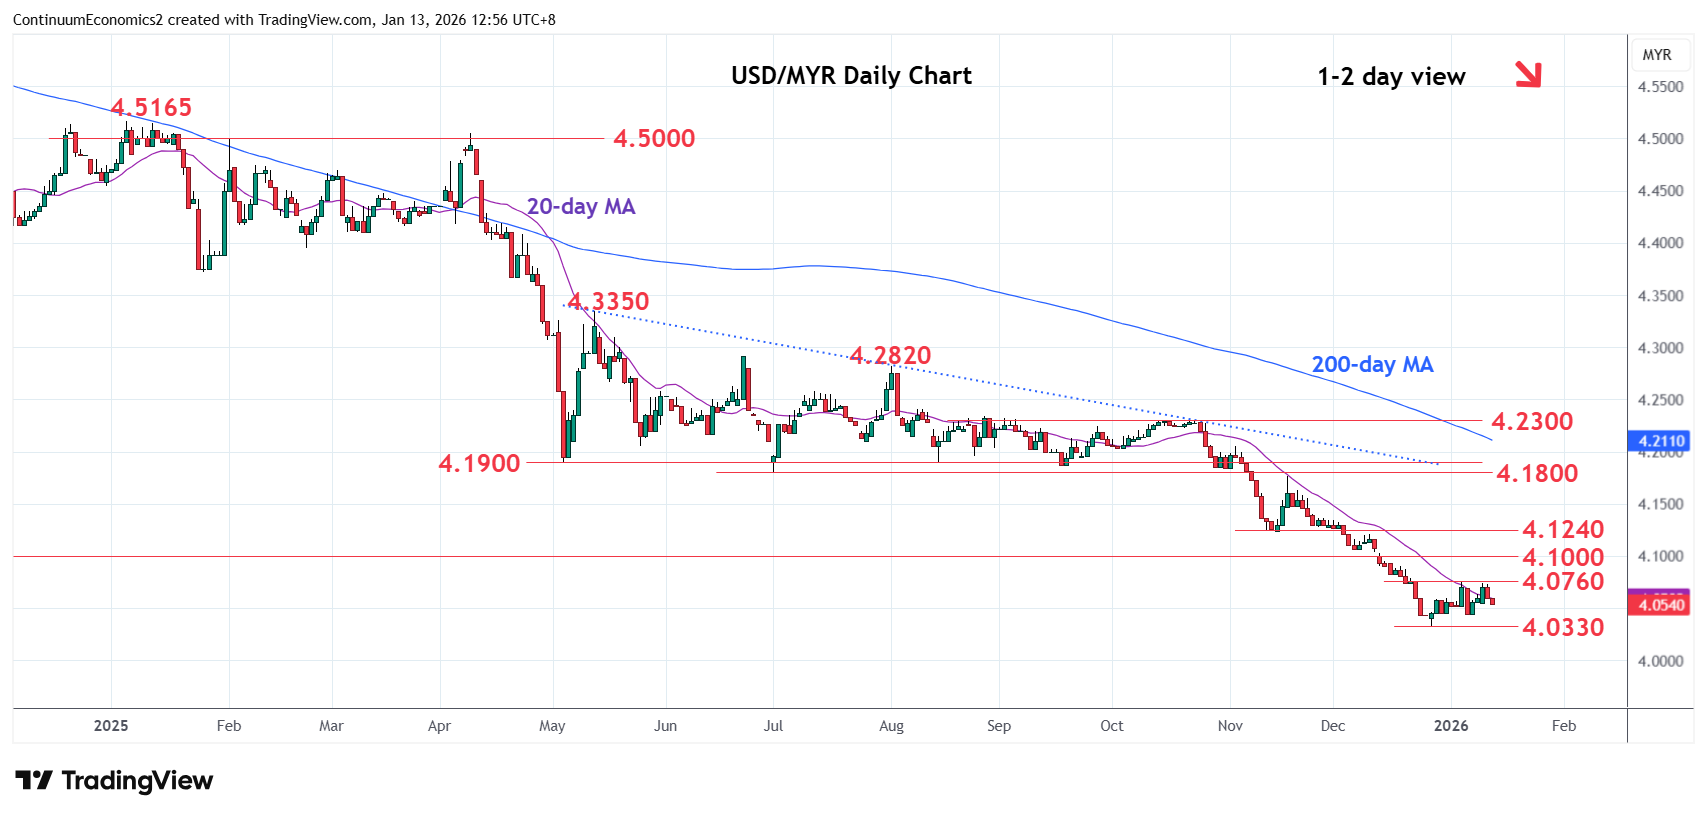
Extending consolidation above 4.0330, the December 2025 year low as prices unwind oversold daily and weekly studies
| Levels | Imp | Comment | Levels | Imp | Comment | |||
|---|---|---|---|---|---|---|---|---|
| R4 | 4.1470/00 | * | 18 Nov low, congestion | S1 | 4.0330 | ** | 26 Dec 2025 year low | |
| R3 | 4.1240 | ** | 14 Nov low | S2 | 4.0280 | * | Feb 2021 low | |
| R2 | 4.1000 | ** | Sep 2024 year low | S3 | 4.0000 | ** | Jan 2021 year low | |
| R1 | 4.0760 | * | 5 Jan high | S4 | 3.9700 | * | Jun 2018 low |
Asterisk denotes strength of level
05:00 GMT - Extending consolidation above 4.0330, the December 2025 year low as prices unwind oversold daily and weekly studies. Bounce attempt has met with selling pressure at the 4.0760 high and rejection here threatens pullback to retest of the 4.0330 low. Break of the latter will open up room for extension to support at 4.0280 low of February 2021. Lower still, will see room to the 4.0000 figure and the January 2021 year low. Would take break above 4.0760 to open up room for stronger corrective gains to resistance at the 4.1000 level and September 2024 year low.