Published: 2026-01-12T04:38:49.000Z
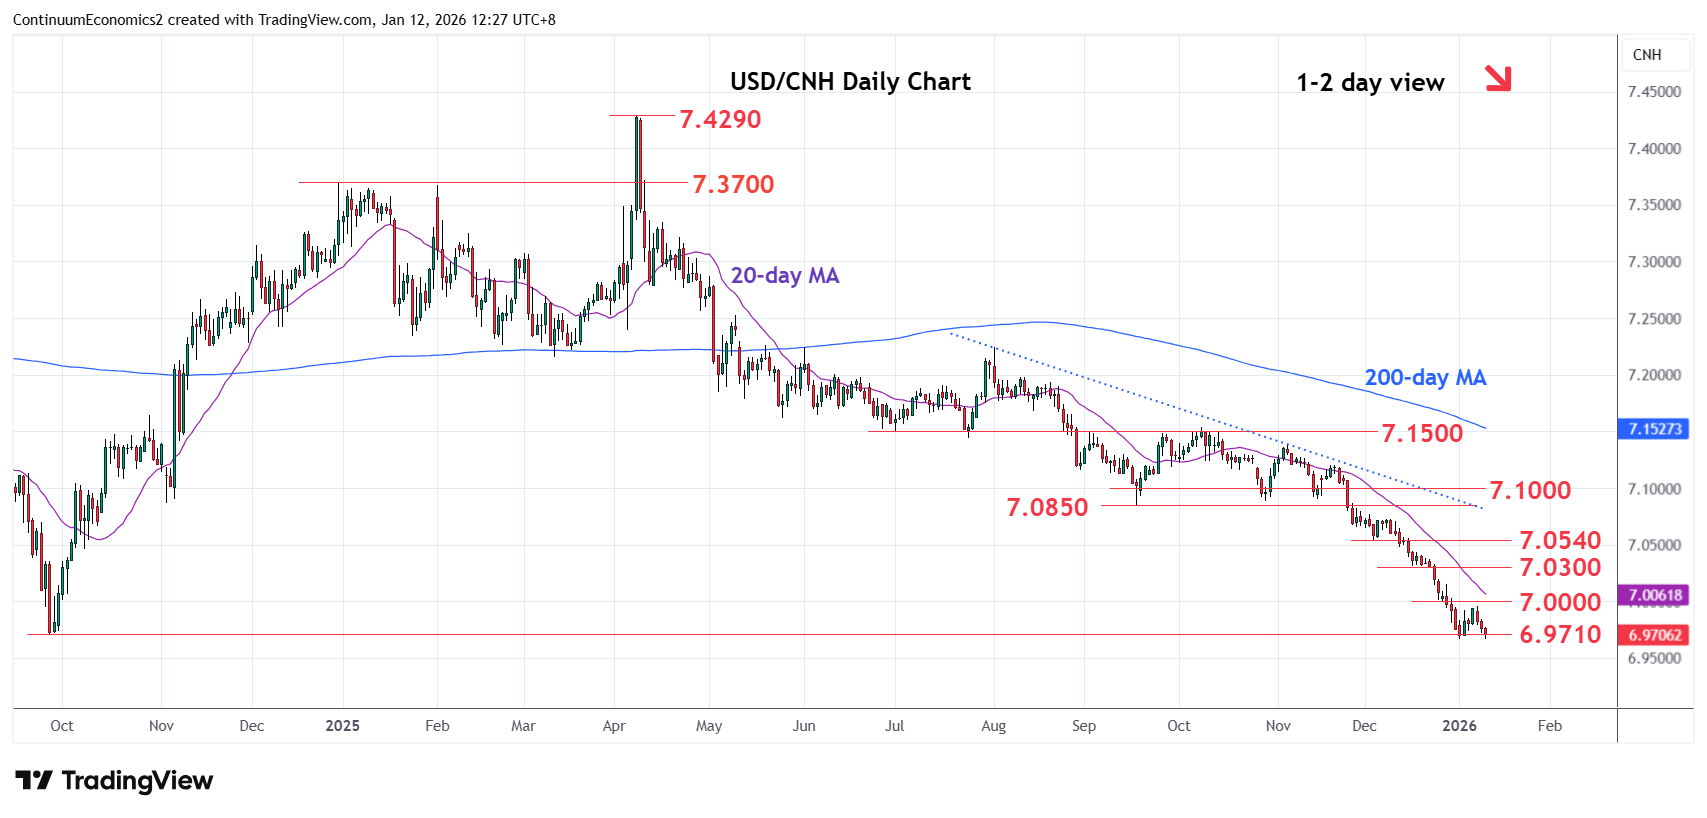
Chart USD/CNH Update: Weighing on 6.9663 low
-
Shallow bounce from the 6.9663 low to consolidate losses from the October swing high has met with selling pressure below the 7.0000 figure
| Level | Imp | Comment | Level | Imp | Comment | |||
|---|---|---|---|---|---|---|---|---|
| R4 | 7.0730 | * | 8 Dec high | S1 | 6.9663 | ** | 2 Jan low | |
| R3 | 7.0500/40 | ** | congestion, 3 Dec low | S2 | 6.9645 | * | 2 May 2023 high | |
| R2 | 7.0300 | * | congestion | S3 | 6.9500 | * | congestion | |
| R1 | 7.0000 | * | congestion | S4 | 6.9300 | * | congestion |
Asterisk denotes strength of level
04:30 GMT - Shallow bounce from the 6.9663 low to consolidate losses from the October swing high has met with selling pressure below the 7.0000 figure. Break of the 6.9710 and 6.9663 lows will further extend losses from the 7.4290, April 2025 year high. Lower will see room for continuation to support at the 6.9645/6.9500 area. Meanwhile, resistance at the 7.0000 figure is expected to cap. would need lift over this to ease the downside pressure and see room for corrective bounce to the 7.0300 congestion and strong resistance at 7.0500/40 area.