Published: 2026-02-20T04:50:04.000Z
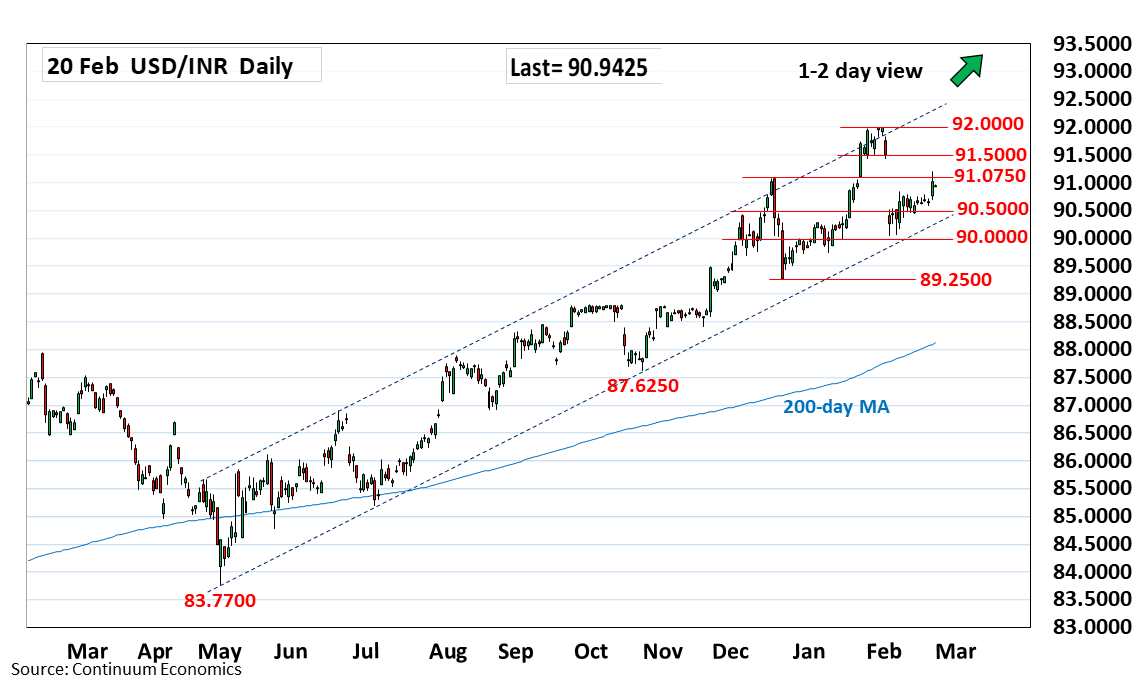
Chart USD/INR Update: Consolidating at 91.0000
2
No follow-through on break above the 91.0750 resistance as prices settled back in consolidation from the 91.2000 high
| Level | Comment | Level | Comment | |||||
|---|---|---|---|---|---|---|---|---|
| R4 | 92.1300 | * | extension | S1 | 90.5000 | * | congestion | |
| R3 | 91.9875 | ** | 30 Jan all-time high | S2 | 90.0000 | * | figure, congestion | |
| R2 | 91.5000 | * | congestion | S3 | 89.7400 | * | Jan low | |
| R1 | 91.0750 | ** | Dec high | S4 | 89.5000 | * | congestion |
Asterisk denotes strength of level
04:45 GMT - No follow-through on break above the 91.0750 resistance as prices settled back in consolidation from the 91.2000 high. However, further gains cannot be ruled out and higher will see room for extension to resistance at the 91.5000 congestion. Gains are seen corrective and lower high sought to pressure the downside later. Meanwhile, support at the 90.8400/90.5000 area now underpin. Would take break here to return focus to the downside for retest support at the 90.0000 figure and extend losses from 91.9875, 30 January all-time high.