Published: 2025-11-18T03:06:48.000Z
Chart USD/THB Update: Higher in consolidation
1
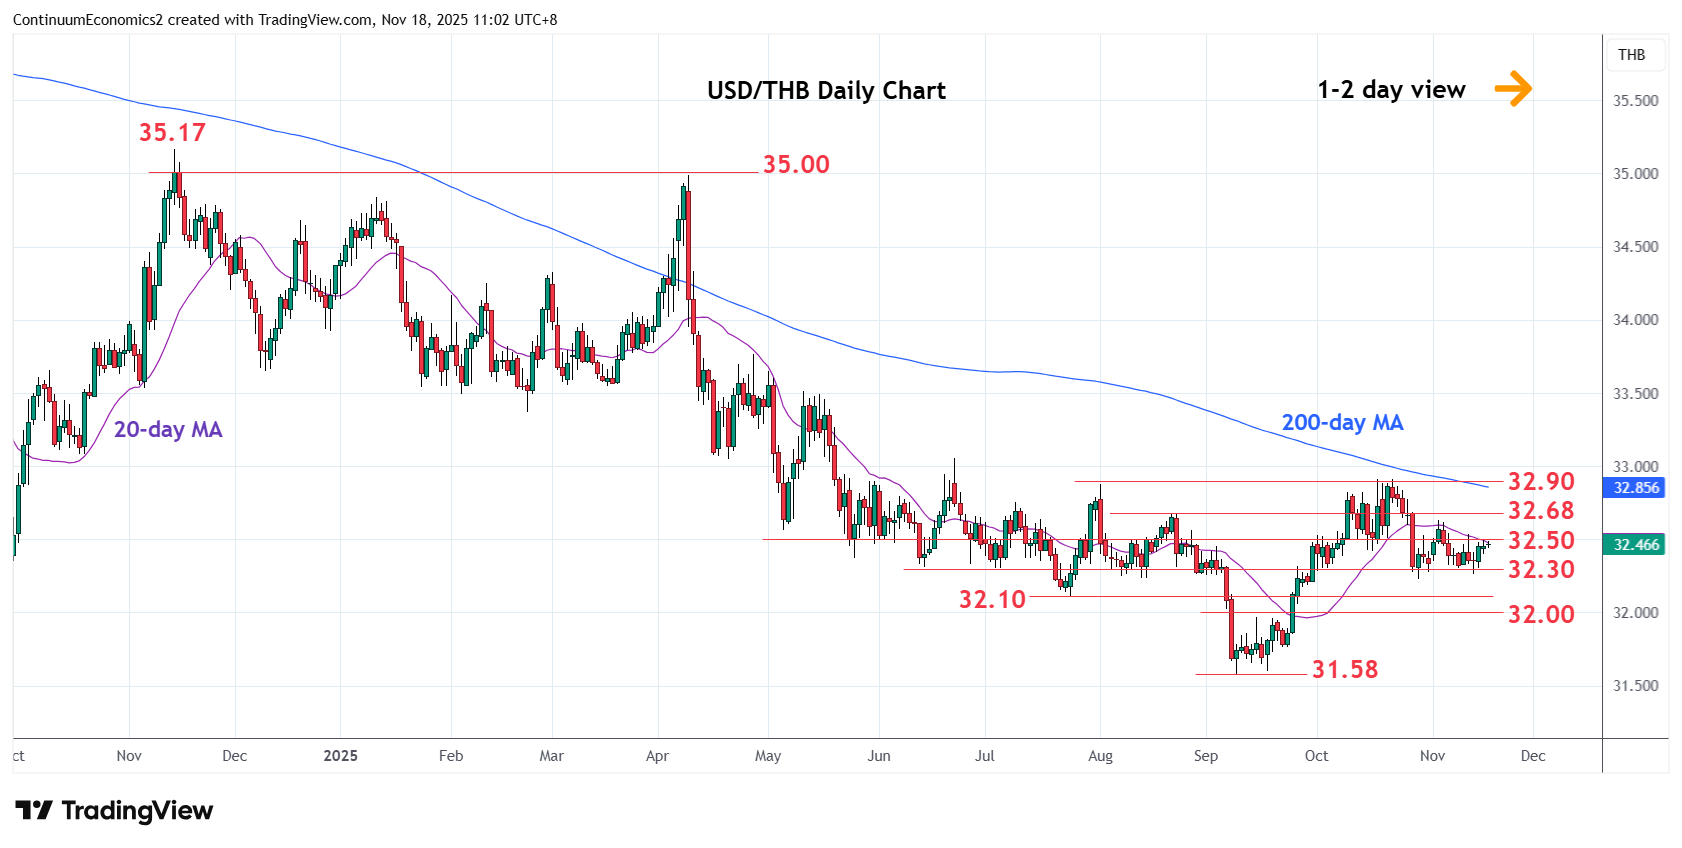
Bounce from the 32.30/32.23 support see prices unwinding oversold daily studies
| Level | Comment | Level | Comment | |||||
|---|---|---|---|---|---|---|---|---|
| R4 | 32.95 | * | 38.2% Nov 2024/Sep fall | S1 | 32.30 | ** | Jun low, congestion | |
| R3 | 32.88/90 | ** | 1 Aug high, congestion | S2 | 32.23 | * | Oct low | |
| R2 | 32.68 | * | 22 Aug high | S3 | 32.10 | ** | Jul low | |
| R1 | 32.50 | * | congestion | S4 | 32.00 | * | figure |
Asterisk denotes strength of level
03:05 GMT - Bounce from the 32.30/32.23 support see prices unwinding oversold daily studies and returning to pressure resistance at 32.50. Break here will open up room for stronger gains to resistance at the 32.63/32.68 area which is expected to cap and give way to renewed selling pressure later. Meanwhile, support at the 32.30/32.23 lows now underpin. Would take break here to open up room for extension to strong support at the 32.10 July low and the 32.00 figure. Break here will return focus to the 31.60/31.58, September current year low.