Published: 2026-03-19T03:35:26.000Z
Chart USD/THB Update: Extending gains
-
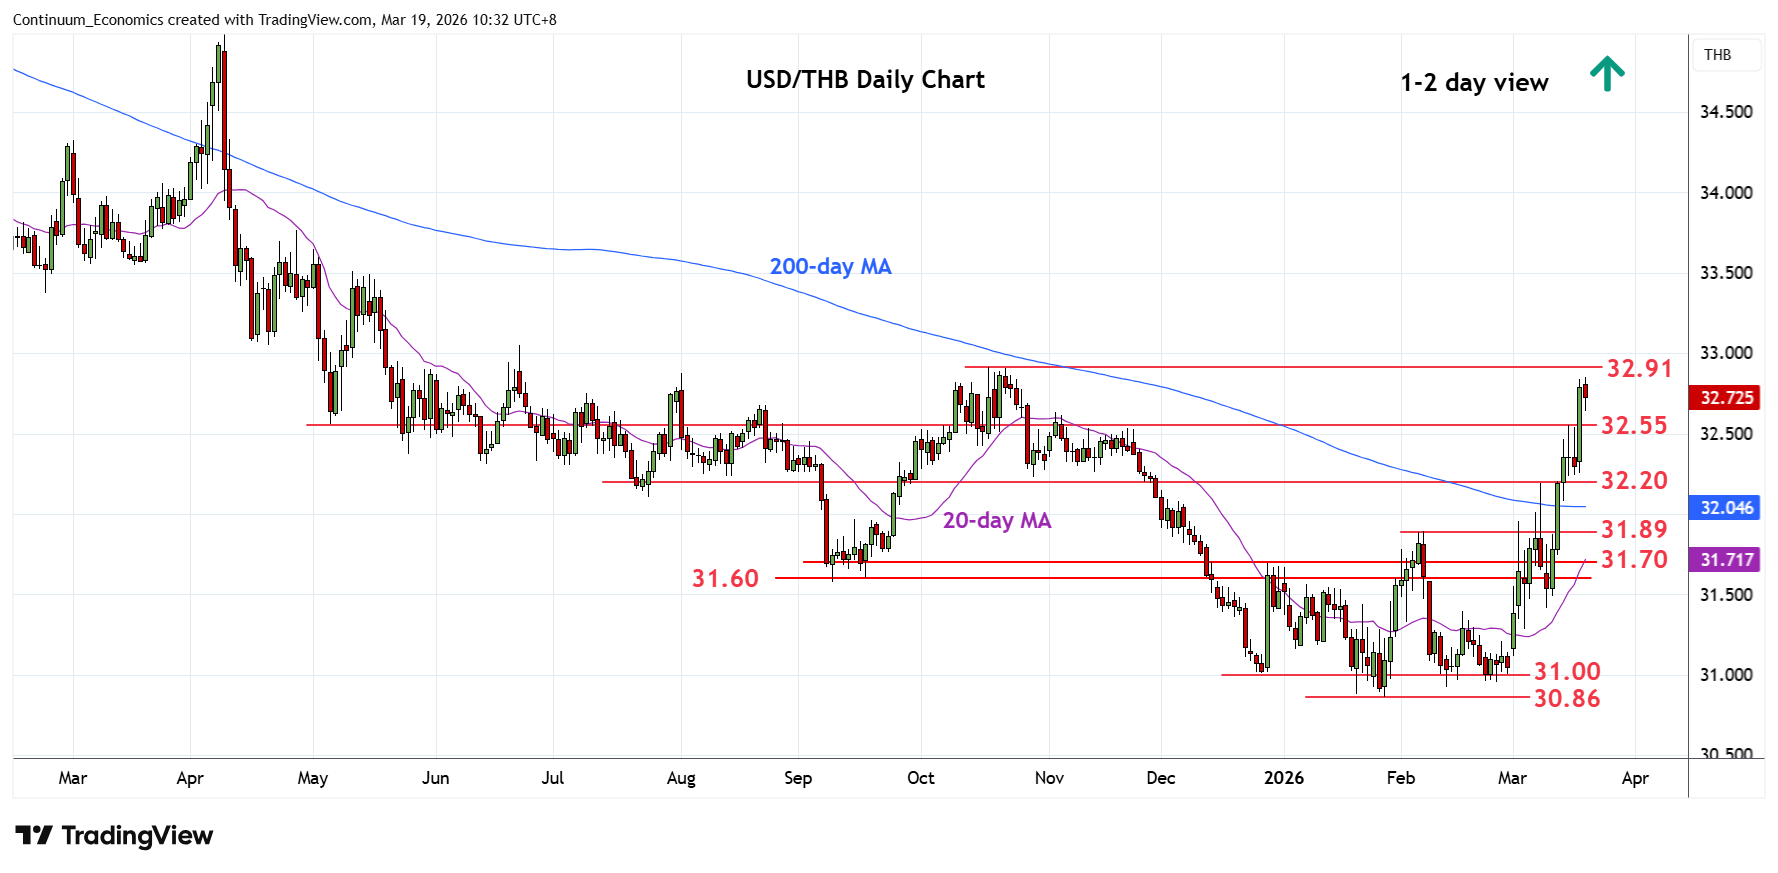
Consolidation below the 32.55 highs has given way to break to extend the January gains to post fresh year high at 32.85
| Level | Comment | Level | Comment | |||||
|---|---|---|---|---|---|---|---|---|
| R4 | 33.20 | * | congestion | S1 | 32.55 | * | 16, 17 Mar highs | |
| R3 | 33.00/05 | * | figure, Jun high | S2 | 32.20 | * | congestion | |
| R2 | 32.93 | * | 50% 2025/Jan fall | S3 | 32.00 | * | congestion | |
| R1 | 32.91 | ** | Oct high | S4 | 31.89 | ** | Feb high |
Asterisk denotes strength of level
03:30 GMT - Consolidation below the 32.55 highs has given way to break to extend the January gains to post fresh year high at 32.85. Nearby see scope to resistance at 32.91/32.93, October high and 50% Fibonacci retracement. Would expect reaction here to unwind overbought daily studies but a later break cannot be ruled out to further retrace losses from losses from the April 2025 year high. Meanwhile, support is raised to the 32.55 highs of Mondy/Tuesday which should underpin. Below this will ease upside pressure and see room for deeper consolidation to 32.20/31.89 support.