Published: 2026-03-06T02:10:43.000Z
Chart USD/SGD Update: Extending gains
1
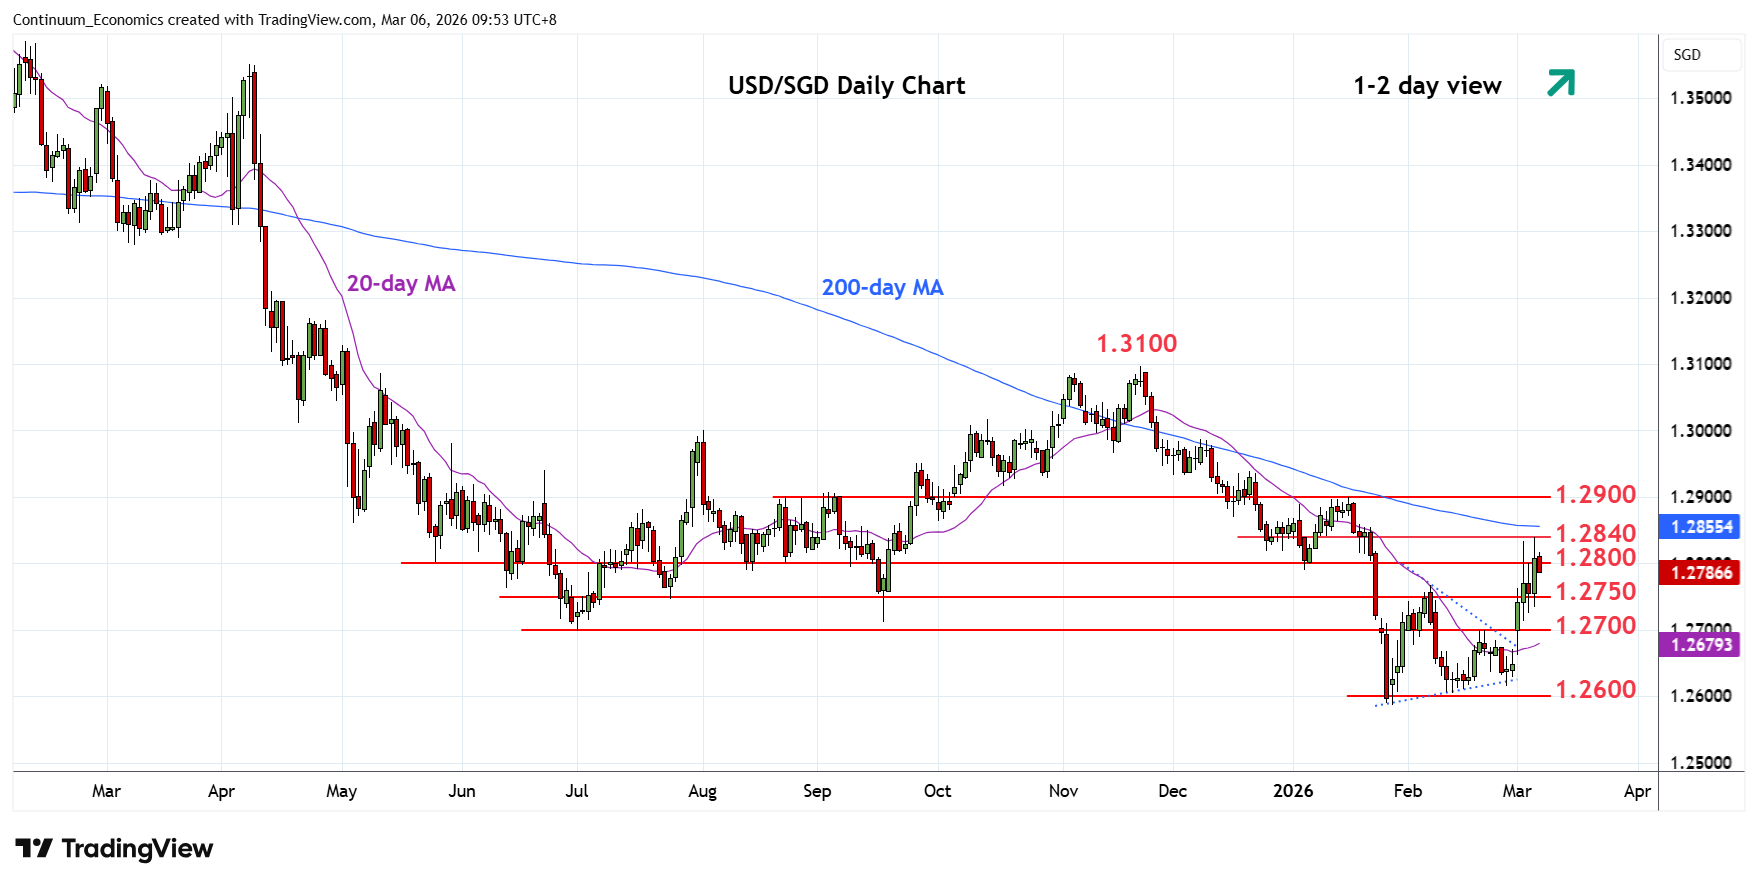
Settled back to consolidate at the 1.2800 level following gains to resistance at 1.2840, 50% Fibonacci level
| Level | Comment | Level | Comment | ||||
|---|---|---|---|---|---|---|---|
| R4 | 1.3000 | ** | congestion | S1 | 1.2768/50 | ** | Feb high, congestion |
| R3 | 1.2938 | 19 Dec high | S2 | 1.2700 | ** | 19 Feb high, congestion | |
| R2 | 1.2900 | * | 16 Jan YTD high, 61.8% | S3 | 1.2650 | congestion | |
| R1 | 1.2840 | * | 50% Nov/Jan fall | S4 | 1.2615/00 | * | 26 Feb low, congestion |
Asterisk denotes strength of level
02:10 GMT - Settled back to consolidate at the 1.2800 level following gains to resistance at 1.2840, 50% Fibonacci level. Consolidation see prices unwindng overbought intraday studies but this is expected to give way to fresh buying interest later to extend gains from the 1.2586, January current year low. Higher will see room for extension to retest the 1.2900, January current year high 61.8% Fibonacci level. Meanwhile, support is raised to the 1.2768/50, February high and congestion area, which should underpin. Only below here ease the upside pressure and see room for pullback to 1.2700 support.