Published: 2025-10-28T05:55:56.000Z
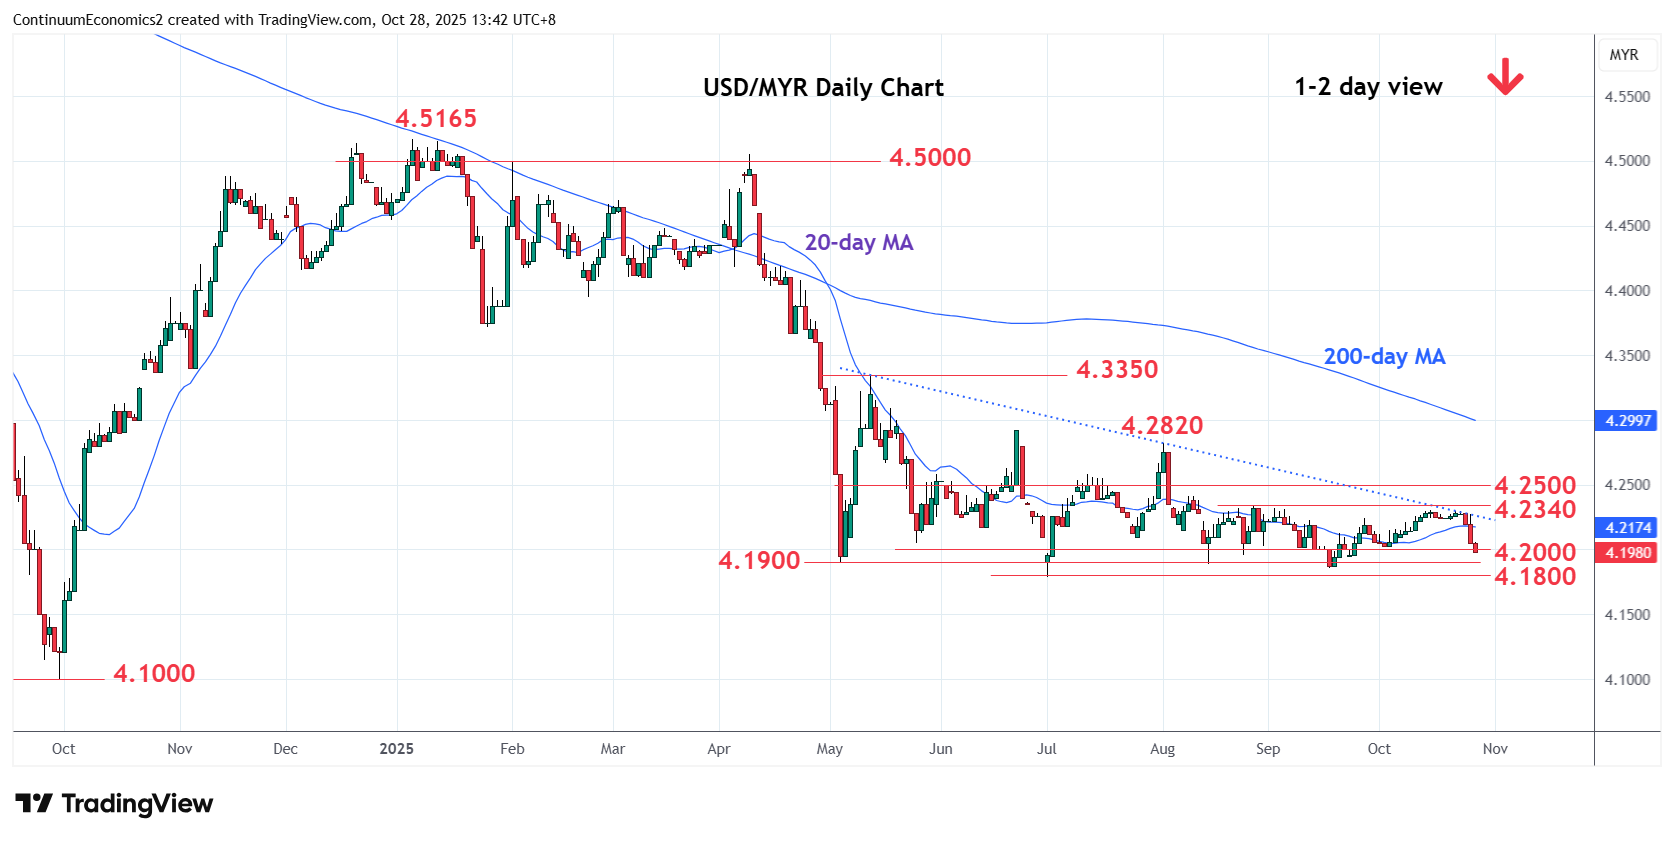
Chart USD/MYR Update: Sharp pullback return focus to 4.1900/4.1800 lows
1
Sharply lower following rejection from the 4.2300/40 resistance as prices unwind overbought daily and weekly studies
| Levels | Imp | Comment | Levels | Imp | Comment | |||
|---|---|---|---|---|---|---|---|---|
| R4 | 4.2500 | * | congestion | S1 | 4.1900 | * | May low | |
| R3 | 4.2400 | * | 8 Aug high | S2 | 4.1800 | ** | 1 Jul YTD low | |
| R2 | 4.2300/40 | ** | congestion, 27 Aug high | S3 | 4.1500 | * | congestion | |
| R1 | 4.2230 | * | 21 Oct low | S4 | 4.1150 | * | 25 Sep 2024 low |
Asterisk denotes strength of level
05:50 GMT - Sharply lower following rejection from the 4.2300/40 resistance as prices unwind overbought daily and weekly studies. Break of the 4.2000 level return focus to the 4.1900 and 4.1800, May and 1 July current year lows. Below these will extend losses from the 4.5165 January current year high and see room to the 4.1500 congestion but focus will return to the 4.1000, September 2024 year low. Meanwhile, resistance is lowered to 4.2200/4.2230 area and this is now expected to cap and sustain losses from the 4.2300/4.2340 resistance.