Published: 2026-03-26T04:23:17.000Z
Chart USD/MYR Update: Extending gains
1
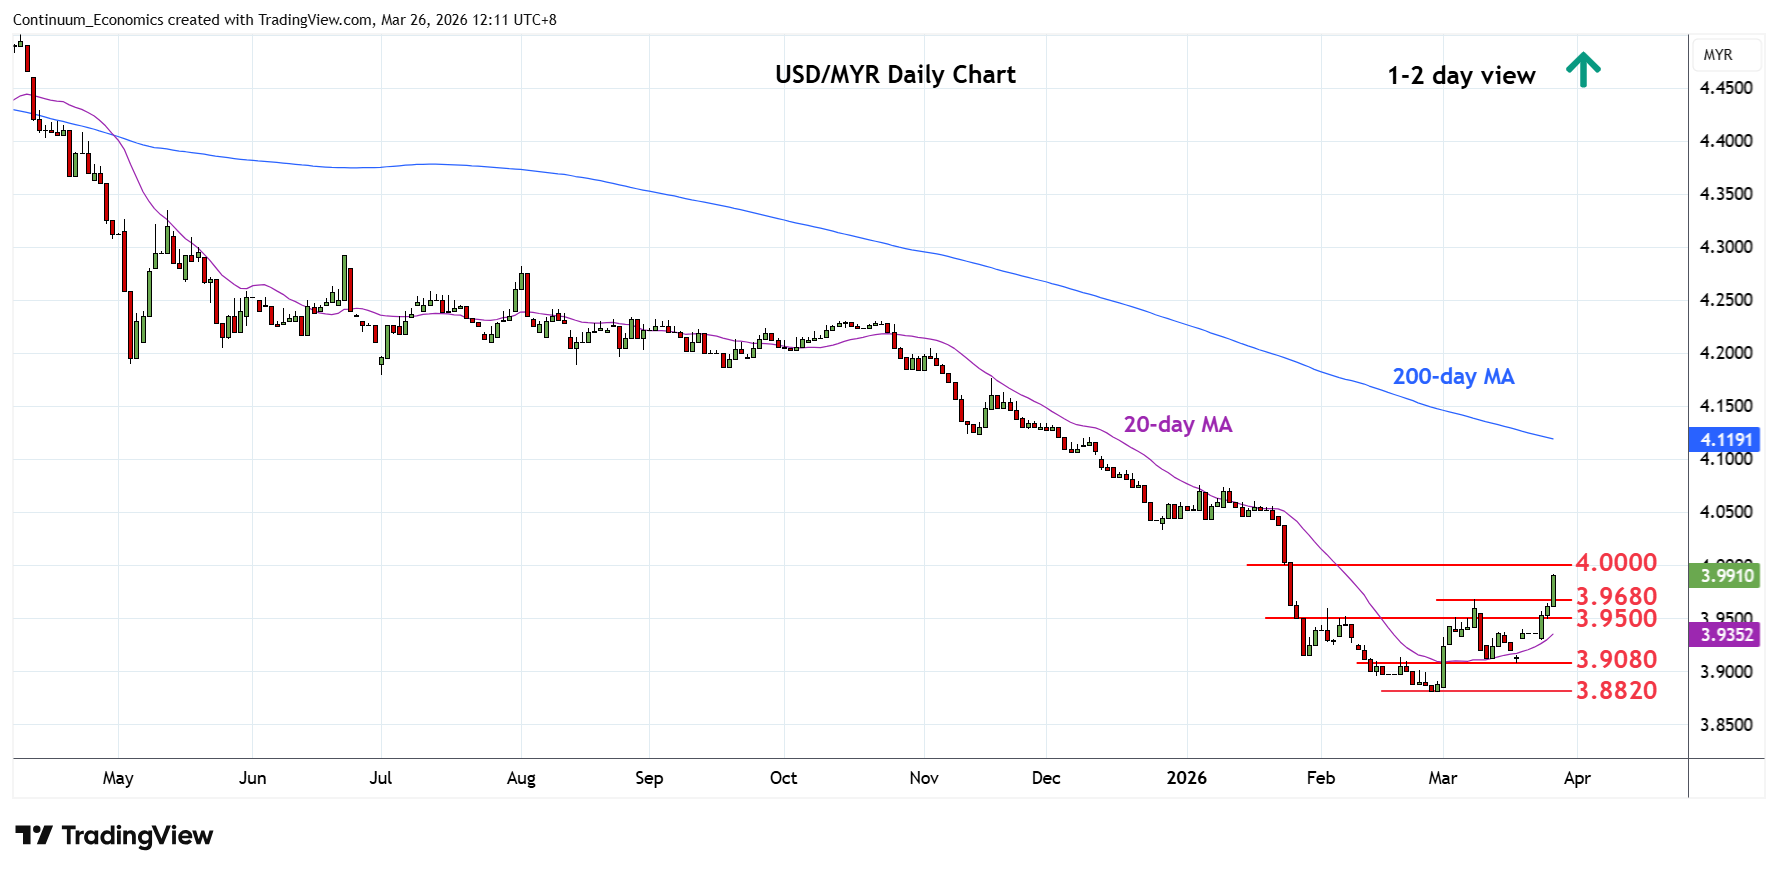
Gains above resistance at the 3.9500 congestion has seen follow-through above the 3.9680 March high
| Levels | Imp | Comment | Levels | Imp | Comment | |||
|---|---|---|---|---|---|---|---|---|
| R4 | 4.0500 | * | congestion | S1 | 3.9500 | * | congestion | |
| R3 | 4.0330 | * | Dec low | S2 | 3.9300 | * | 26 Mar low | |
| R2 | 4.0150 | * | 38.2% Oct/Feb fall | S3 | 3.9080 | * | 18 Mar low | |
| R1 | 4.0000 | ** | figure, congestion | S4 | 3.8820 | ** | 26 Feb YTD low |
Asterisk denotes strength of level
04:15 GMT - Gains above resistance at the 3.9500 congestion has seen follow-through above the 3.9680 March high to extend gains from the 3.8820, February YTD low. Break here will confirm a 2-month bottom pattern in place at the 3.8820 low and see room for stronger gains to retrace losses from the 4.2300 high of October to the 4.0000 figure where reaction can be expected. Clearance here will see room to resistance at 4.0150 38.2% Fibonacci level and 4.0330, December low. Meanwhile, support at the 3.9500 congestion is expected to underpin and sustain corrective bounce from the 3.8820 low.